Air permits are issued by governing entities whose purpose is to limit the emission of harmful airborne pollutants from commercial and industrial processes. The history of organized air pollution control in the United State starts with the passage of the Clean Air Act (CAA) in 1970, after centuries of relatively unregulated industrial pollution. The CAA requires the Environmental Protection Agency (EPA) to maintain, “national ambient air quality standards (NAAQS) for certain common and widespread pollutants, known as criteria pollutants,” (epa.gov). Today, the following are listed criteria pollutants: 8-hour ozone, 1-hour ozone, sulfur dioxide, carbon monoxide, nitrogen dioxide, lead, PPM 2.5, and PPM 10. The EPA is directed by the CAA to set standards for these pollutants “without regard to costs of implementing pollution controls to achieve the standards,” and share the responsibility for mitigation and enforcement equally with the States (epa.gov). Each state is required to develop plans to ensure compliance with the CAA standards. Areas of the country that do not meet national standards for air quality are termed “non-attainment areas,” and must work to improve their air quality. States are required to try and minimize pollution drift into neighboring states and are permitted to delegate enforcement work to jurisdictions and agencies as they see fit. Figure 1 shows the most recent map of nonattainment and maintenance for counties in the US, and the number of criteria pollutants for which each county is receiving the designation.
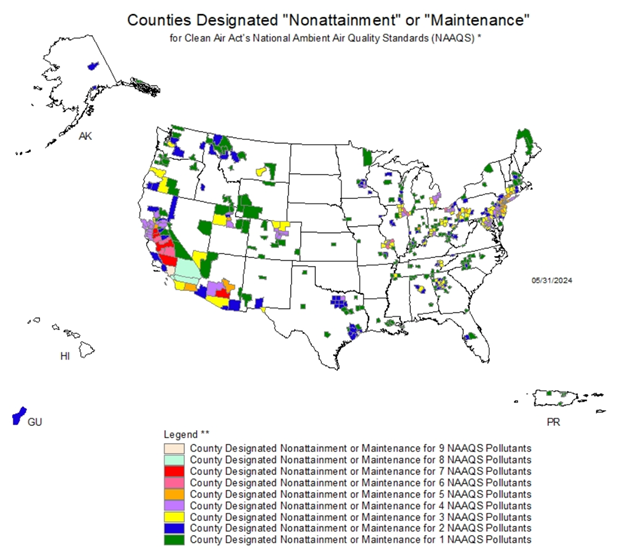
Figure 1 – US counties failing to attain or at risk of not attaining national clean air standards for 1 or more criteria pollutants
The CAA has been hugely successful in preserving and improving air quality throughout most of the country over the last five decades and perhaps nowhere more than in California. This may be shocking given that the highest concentration of non-attainment districts in the country continue to be in California, but “between 1970 and 2020, the combined emissions of the six common pollutants (PM2.5 and PM10, SO2, NOx, VOCs, CO and Pb) dropped by 78 percent,” (epa.gov).
While the CAA regulates both mobile and stationary sources of air pollution, it is up to states to decide how to divide the work of enforcement up. Stationary sources are any source of air pollution except for those emissions which result directly from an internal combustion engine for transportation purposes or from a nonroad engine or nonroad vehicle (Cornell Law). California delegates regional air quality monitoring and enforcement to its Air Quality Management Districts (AQMDs), which have the responsibility of permitting only stationary sources of pollution. Mobile sources are regulated by the California Air Resources Board (CARB), who set requirements like fuel efficiency standards. The story of air pollution management in California is important to understand because they were among the first states to implement air pollution reduction plans, and their standards have been highly influential to other states.
Empowered by the obligation to mitigate criteria pollutants in their districts, AQMDs began source testing emissions from compost facilities in the 1990’s. Composting processes, especially poorly-optimized ones, can emit significant quantities of volatile organic compounds (VOCs), oxides of nitrogen, fine particles (dust), and ammonia. Occasionally these compounds can interact to produce ground-level ozone, a serious criteria pollutant in CA. Unfortunately for the industry, California’s Air Resources Board (CARB) and AQMDs calculated a default emission factor (EF) that was much higher than would be reflected in a normal windrow composting process, and much, much higher than in an optimized aerated composting process (valleyair.org).
The EF of 3.58 lbs of non-methane, non-ethane VOCs per wet ton of ‘green waste’ feedstock represents the average of a set of source test results from passively-aerated (windrow) facilities which were available in 2015. As shown in Figure 2, this “average” was inflated by the EFs measured at the three privately owned sites in this data set. The rate of VOC emissions is driven by both the feedstock mix and the process conditions, both of which can be manipulated to minimize or to maximize emissions. The ECS Low Odor Composting blog details this relationship. These source tests took place during the development of composting air emission rules when it was well known that EFs measured at existing facilities would constitute a grandfathered “right to pollute”. The facilities tested had no incentive not to maximize their VOC EFs. The result of this default EF has adversely impacted facility permitting efforts ever since.
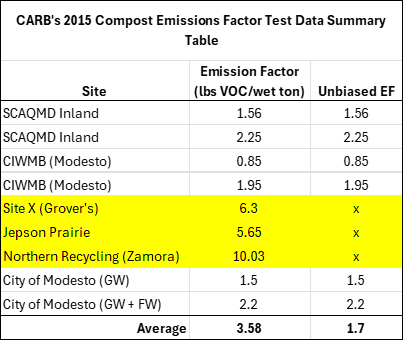
Figure 2 – 2015 CARB compost emissions study
The above numbers are all uncontrolled, meaning that there was no means to capture and control air emissions leaving the pile by methods such as a biolayer, surface irrigation, fabric cover, or exhausting a captured airstream to a biofilter.
These numbers have created many subsequent challenges for new and existing compost facilities. Principally among these is that an EF of 3.58/ lbs VOC/wet ton, makes even a small facility vulnerable to qualifying as a Title V polluter, requiring a federally-issued Title V permit. A Title V pollution designation, based on a stationary site’s verified emissions factor, or potential to emit (PTE) factors, triggers a series of other conditions for a facility including increased monitoring, recordkeeping, and reporting requirements, mandates for pollution control devices, and soliciting input from the public. The chart in Figure 3 below shows the maximum annual emissions (in tons per year) that a stationary source may emit before needing a Title V permit to operate.
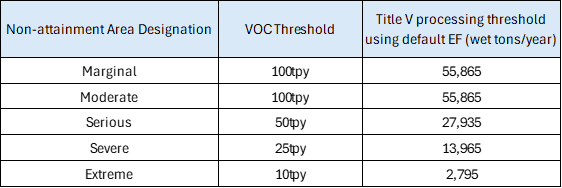
Figure 3 – Non-attainment thresholds for emissions and processing
Almost all air permits will set some kind of condition on the design, operation, air performance, and reporting requirements for each facility. These conditions can be agreeable, or onerous, adding significant time and expense to the development and operation of a site. Here are a few examples of permit conditions which can create long-term financial and operating risks for a composter:
Regulators write air permits with the goal of limiting the negative health impacts of air emissions, which we can all agree is a valuable project. However, misunderstandings about compost processing and use have created challenges that facilities in most states now face. Chief among these persistent misunderstandings is how to determine a reasonable compost emissions factor (EF).
Bolstered by concerns over climate change, awareness of organic and regenerative agriculture practices, and legislation aimed to keep organics material out of landfill, the demand for new compost facilities and increased composting capacity has never been higher. Aeration system technologies have also greatly reduced composting’s PTE.
In our blog post on Low Odor Composting, we outlined biological science of odor and VOC generation in a pile. After all, most VOCs are odors, and all odors are VOCs. By improving the process conditions in a pile, a facility can massively reduce the emission of both VOCs and odors. “Process Conditions” refers to a set of parameters which encourage rapid, low odor bio-oxidation. These include having adequate moisture levels (50-60%), sufficient pore-space oxygen (>10%), and an early mesophilic period (<40C) to shift pH from acidic to neutral. All ECS-designed systems are designed to do just that, and we have measured their effectiveness. Recent source testing at two different well-run, ECS-built sites have shown that the average, controlled emission factors are more than 20 times lower than the baseline numbers used by California AQMDs. Figure 4 below shows our findings from each of the tested green waste processing facilities, one in Washington (WA) and one in Northern California (CA). WA combines positive and negative static aeration with a biofilter for both their primary and secondary composting. CA utilizes positive-only aeration in their biolayer-capped primary ASPs, and unaerated, uncontrolled static secondary piles.

Figure 4 – Low emission factors produced at two optimized compost facilities
The numbers above are a radical departure from the conventional EFs used by many air permitters when assessing a new facility. These updated EFs were obtained utilizing the industry’s standard source testing method. The standard method for evaluating VOC emissions from a compost pile is called SCAQMD Method 25.3, named after the Southern California air district that popularized it. This method utilizes a surface flux isolation chamber to collect the emissions coming off a very, very small part of a compost pile. The air sample collected in the flux chamber passes over an ice bath impinger where water-soluble gases like alcohols and aldehydes dissolve in the water and are analyzed. The non-water-soluble gases are transported down the testing chain into a SUMMA Cannister where the (unspeciated) VOCs are counted using Gas Chromatography/FID methods. The sum of VOCs from the water and gas sample determines total VOC concentrations (ppm). This result is extrapolated to the entire mass of the pile and, frankly, the entire throughput of the system.
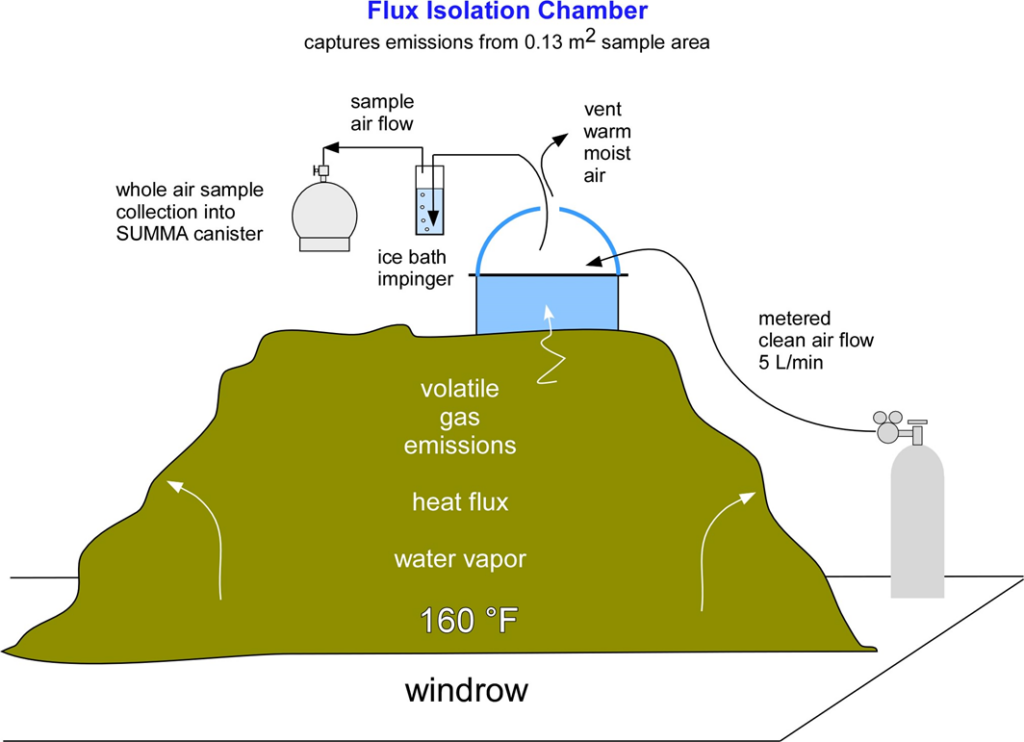
Figure 5 – measuring compost emissions per the SCAQMD method 25.3
The drawbacks of this test method are numerous. The most apparent shortcoming of this test method is that the size of the sample precludes any sincere representation of the whole pile. Precise, but not accurate. The flux chamber is 18-24” wide, while the pile it is attempting to sample may be upwards of 100’ long. And sample from a flux chamber represents a tiny window of insight into one small part of a pile in a specific moment in time, but is not by any means a representation of the whole pile or operation.
Secondly, we understand that the VOC emissions rate of compost is inversely proportional to the rate of stabilization. Over the course of a well-managed pile’s life, we would expect VOC emissions to be highest in the first 7 days and significantly lower through the end of active composting, secondary composting, and curing. If a sample is taken on day 3 versus day 13, we would expect to see VOC concentrations that are massively higher than in more stabilized material. Dr. Tom Jobson of Washington State University has done research to correlate the speed of stabilization (calculated as days to reach Solvita 5+) and the VOC EF’s. His findings, given in the chart below, indicate that for a well-optimized compost process with quick rates of stabilization, a much lower PTE VOC EF is acceptable.
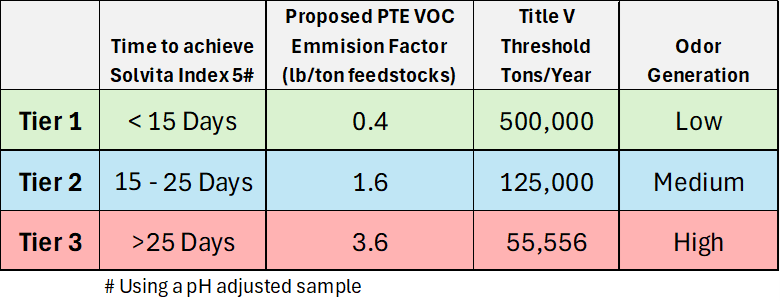
Figure 6 – Proposed compost emission factors based on time required to reach Solvita Index # 5. Odor/VOC generation inversely related to rate of stabilization.
If Figure 3 wasn’t impressive, the chart above also illustrates how impactful the selected EF is on a facility’s processing threshold. Compared to an EF of 3.6 lbs/wet ton, a facility with an EF of 0.4lb/wet ton could process 9.9 times as much material before qualifying as a Title V polluter.
The last shortcoming of the SCAQMD Method 25.3 that we will mention here is cost. The sampling and analyses frequently cost between $50,000 and $100,000 per testing event. Compost facilities lack wide profit margins, and the costs of these tests are massively burdensome. Even if testing proves to a regulator that their emissions factors are low and their permitted capacity should be higher, testing costs can delay or even stop this effort.
Every state approaches air permitting for compost facilities differently. It is essential that you understand the laws, policies, and procedures in your state clearly. Many states have followed California’s lead in using their default EF’s (3.6 lbs VOC/wet ton) and requiring Method 25.3 for testing, but not all. Some states’ air permitting agencies are more partial to EPA Method TO-15, for example. However, if you are trying to permit a compost facility in a non-attainment area, or an area with a history of poorly-run compost facilities (which may have had memorable odor or pollution events), you will need to be more tactful in your approach and more strategic in your site design.
It is effective to work backwards – understanding what the attainment designation is first, then the type of feedstock you are looking to process, followed by the amount of material you plan on accepting, and then select and budget for the right technologies to keep your facility under the PTE threshold.
Compost facilities that maintain optimal process conditions have demonstrably lower emission and odors. Ensuring that your site can provide adequate levels of aeration throughout the mass of the pile is essential. Utilizing a feedstock mix with the right balance of carbon, nitrogen, moisture, and porosity will help ensure fewer VOC emissions are generated within a given pile.
Once you have ensured you are using a balanced feedstock mix and robust aeration, you can consider capture and control technologies to help drive down emissions further.
In a negative aeration system, where air is drawn through the bottom of the pile, your control device will be a biofilter. A biofilter consists of cool, damp, woody media. The air that is drawn out of the bottom of the piles is exhausted into the biofilter where the air percolates through, and the VOCs dissolve into the cooler, wetter biolayer. Well-maintained biofilters have the potential to capture up to 95% of VOCs from negative exhaust air and can be used to scrub air from an in-building source, like an enclosed tipping floor.
In a positively aerated system, the method of capture is a biolayer. A biolayer is a layer of either stabilized compost or overs which gets applied in a ~12” layer to the top of a compost pile. The biolayer is kept moist using surface irrigation, and it works using the same principles as the biofilter. As the air moves out of the top of the pile, VOCs are captured in the cooler, wetter biolayer. Biolayers have a 30-90% capture rate, depending on qualities like moisture level, layer depth, and layer particle size/porosity.
In a compost system with reversing aeration, you employ both biofilters and biolayers as scrubbing of VOCs will need to be done in both directions that exhaust air flows.
In an in-vessel system that employs recirculating aeration, some portion of the exhaust air will be diffused to a biofilter, while the majority of exhaust air gets reintroduced to the feedstocks along with a replacement volume of fresh air. This maintains the necessary oxygen levels while achieving 85-95% scrubbing efficiency of exhaust air VOCs.
The equation given below is highly simplistic, but it represents a starting point for thinking about your operation’s total, controlled emissions from the piles.

More can be read about these technologies and their benefits on our Systems page.
The permitting process and its outcomes vary widely depending on your site’s specific location and the individual regulator assigned to your case. Very often air regulators are unfamiliar with compost science and advancements in industry technology. They may also be wary of new compost operations if there is a history (in their career or region) of odiferous and unruly compost facilities. These are things worth knowing when you approach the process. The bullets below offer some starting strategies for engaging in the permitting process. They are the result of ECS’s 25+ years in the industry spent guiding clients through the process in a variety of states and regions.
Permitting a new compost facility can be difficult, but it is worth engaging fully in the process and seeking out expert advice if you have questions about air permit conditions. ECS can support you in this work for either a new facility, an expansion or acquisition, or a reclassification. Contact us to learn more.
EPA Clean Air Act Overview (https://www.epa.gov/clean-air-act-overview/progress-cleaning-air-and-improving-peoples health#:~:text=Experience%20with%20the%20Clean%20Air,well%20as%20numerous%20toxic%20pollutants)
EPA Clean Air Act in a Nutshell (epa.gov, https://www.epa.gov/sites/default/files/2015-05/documents/caa_nutshell.pdf)
Cornell Law Pollution Definitions (https://www.law.cornell.edu/uscode/text/42/7602)
2015 CARB EFs (https://ww2.valleyair.org/media/hdsoobtp/criteria-compost-emission-factors-report-final-voc-nh3-3-21-23.pdf)