There are many approaches to determining the basis of design for composting systems. Composting science is still relatively new, compared to wastewater management for example, while raw material feedstocks and the regulatory landscape are becoming increasingly demanding. Therefore, it is fairly common to build a system by copying a previous installation or using a regulatory or rules-of-thumb approach. This can result in an under-built system, with inadequate stability and high-odor generation. Or it can result in an over-built, over-costly system, with excess retention time and excess system capability.
In aerobic composting, raw feedstocks are converted by bio-oxidation to stable solids (finished compost), carbon-dioxide, water, Volatile Organic Compounds (VOCs such as methanol or terpenes) and heat, as shown in Figure 1.
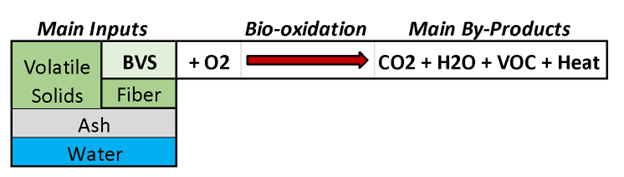
Compost science teaches us that in optimized conditions, Bio-available Volatile Solids (BVS, or “goo”) are rapidly oxidized to produce a lot of CO2, water, and heat, with very little VOCs, achieving rapid stabilization. Any condition that inhibits the consumption of oxygen, such as excessive temperatures, low oxygen levels, or dense mixes, produces more VOCs and slows down stabilization.
Using regulatory or rule-of-thumb approaches tends to over-build systems by an amount that is hard to quantify, since all feedstocks are a little different. Composters risk spending more on infrastructure than needed.
Under-designed systems may also fail to create favorable process conditions. While overheated piles can dry out the material, very little composting might take place. In which case, the final product may suddenly have high VOCs and odors when it gets wet during the next rain.
Air and water permitting regulations are increasingly one of the most significant risk factors to developing a compost system. For large systems, local air pollution control districts may require Best Available Control Technology (BACT). Systems that exceed a minor source threshold for VOCs may require purchasing Emission Reduction Credits (ERCs). Due to limited availability and increasing demand, ERC prices have been skyrocketing. Navigating these emission limits, potential costs, and development timeline pose a major hurdle to launching a new operation.
Pilot programs can help identify the aeration designs and retention time needed to reduce VOCs. While pilot programs work, they can be costly and prohibitively time-consuming. Direct costs includes the cost of the system, labor to operate it, data acquisition and lab analysis. In addition, pilots inherently require iteration. Gathering data, updating hypothesis, and conducting follow up runs can have a long project schedule.
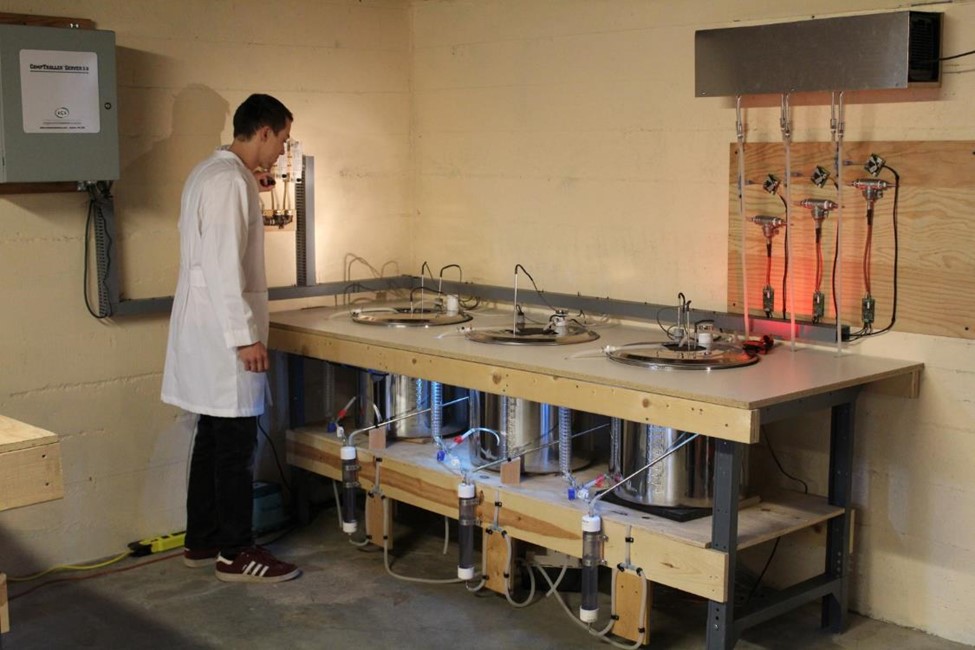
A better approach is process testing, or lab-scale testing of specific feedstock to quantify key design parameters. ECS offers Aeration Demand Testing as a service. This is different and much more involved than sending in a sample for lab analysis. Process aeration demand testing can answer questions such as:
Process testing provides the composter with a repeatable, feedstock-specific, low-cost method to quantify key design parameters.
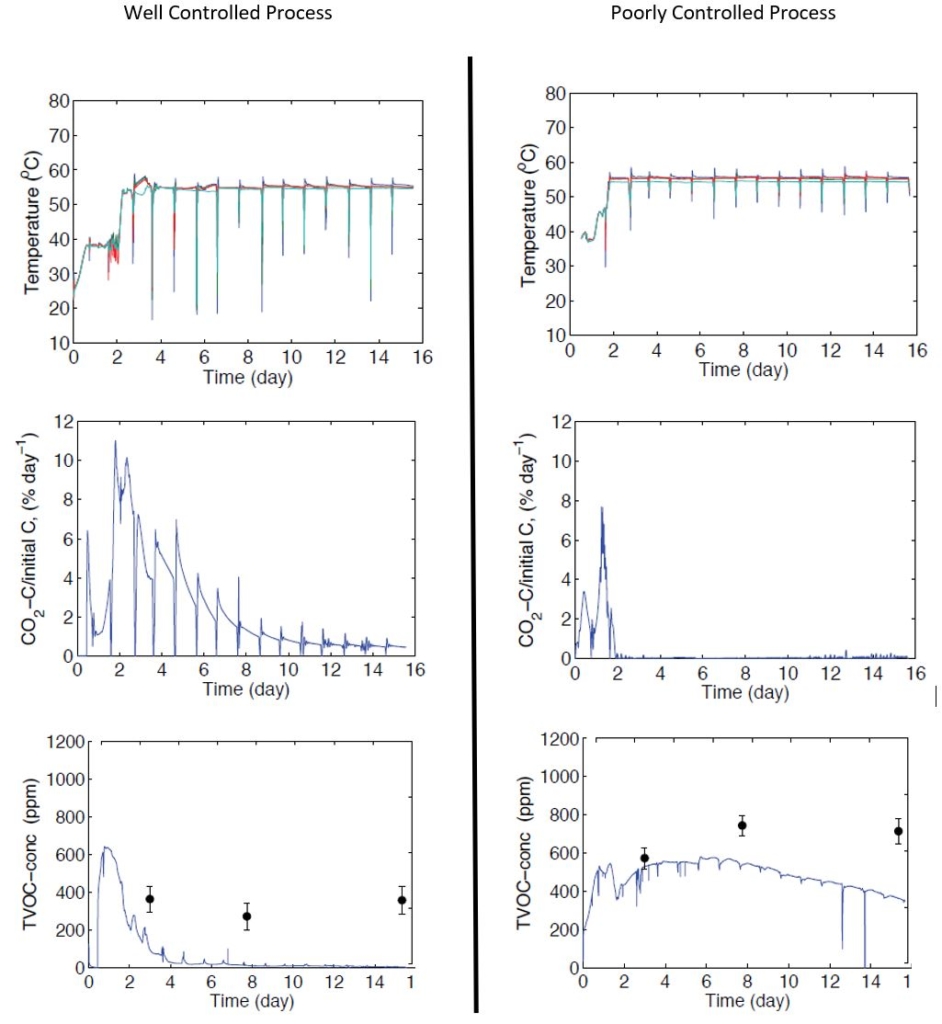
VOC production is basically the opposite of CO2 production, with VOC production indicating anaerobic processing of the BVS and CO2 indicating aerobic processing. As Figure 3 shows, good process control leads to a huge reduction in VOC and odor production over the course of the composting retention time. At the same time, the material releases high amounts of CO2 for the duration of composting, indicating active bio-oxidation. By contrast, the poor process control show high levels of VOC’s and very little signs of bio-oxidation.
For food waste feedstocks, good process control maintains sufficiently low temperatures for an early mesophilic stage that helps neutralize low starting pH prior to reaching thermophilic temperatures. With other feedstocks, good process control helps maintain sufficiently low temperatures to improve oxygen solubility in the film layer, expediting stabilization. In the Figure 3 example, the well controlled process maintains cooler initial temperatures, allowing the mesophiles to increase the pH from ~5 to ~8. By contrast, the pH remains low (~5) for the duration of the poorly controlled process.
The difference in the amount of BVS converted to CO2 can also be huge. Drying out the composting material of a less-efficient process may allow sending it to market at a low Solvita® (not fully matured) and low pH value. If the BVS does not bio-oxidize during primary treatment, it can show up as odor later in the process.
Between feedstock variability, local regulatory conditions, and desired final product, a one-size-fits-all approach results in an inefficient and more costly design. For example, using non-engineering guidelines, a composter may over build by planning four weeks of retention but only need three. Or they may under build by a using pipe-on-grade aeration system with timer-based fans, resulting in poor process control. This could result in lower stability, triggering lower throughput, high VOC emissions, odor complaints, the need to pay for more emission reduction credits, or shutdowns. See Part 2 of this blog post for an example economic analysis.
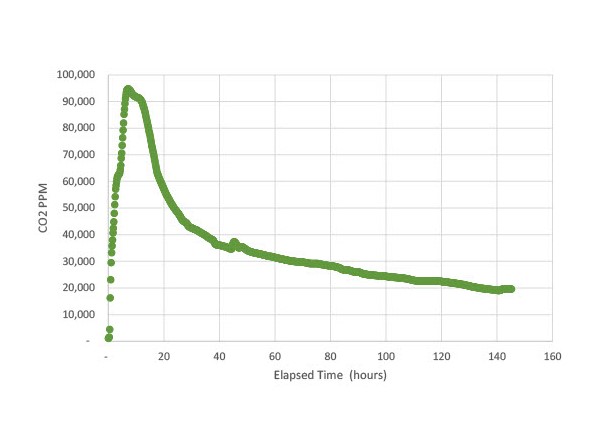
Testing of actual feedstock determines the aeration demand and rate of stabilization needed for a particular situation, so that the design of a particular composting system maximizes return on investment. Figure 4 shows an example of CO2 production during aeration of an actual feedstock sample as measured in the ECS aeration demand testing lab. In this case, using a best management practice mix and high aeration rate, we measured CO2 production similar to the peer-reviewed science curve Sundberg found for a well-controlled aeration process.
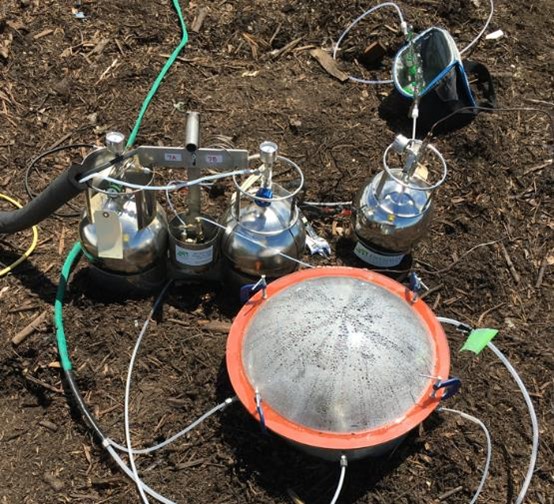
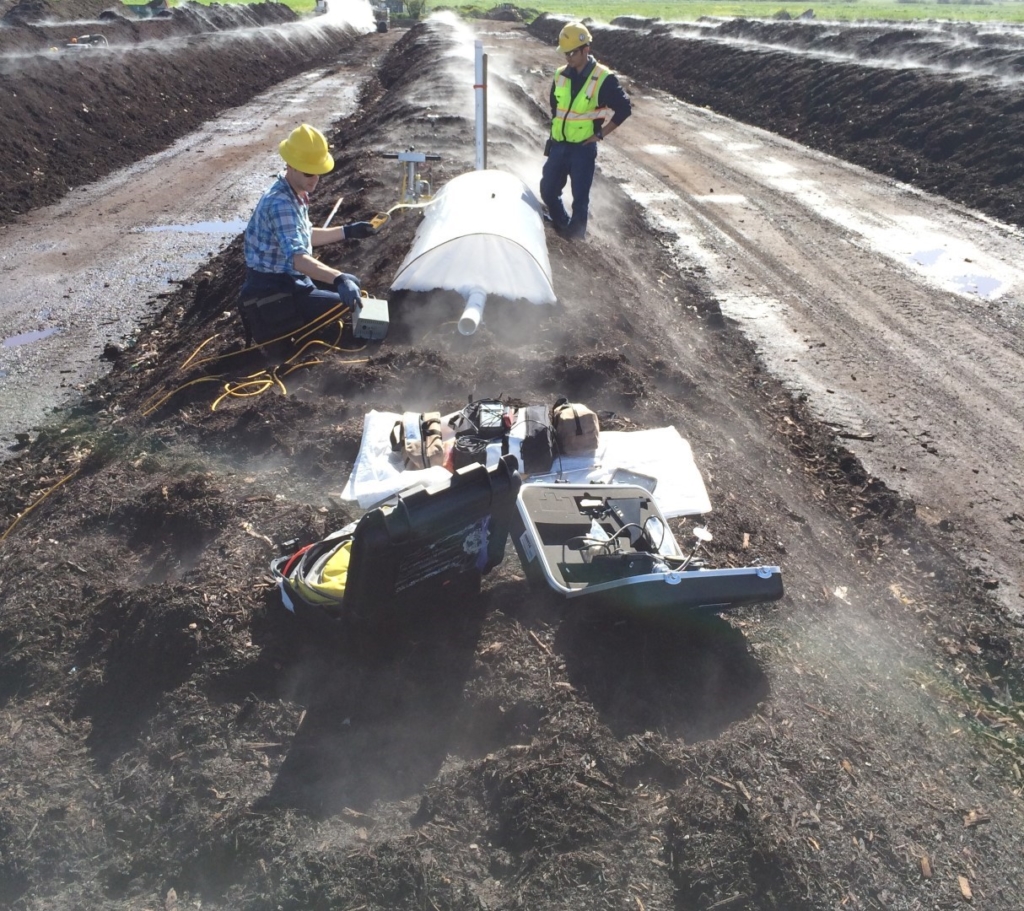
ECS designed a positive Aerated Static Pile (ASP) Facility for a private client in California. The feedstock is yard waste plus 15% food waste. The local air quality district permit threshold was 50 tons/year of VOCs, or 1.8 pounds of VOC per ton of mix. Our project averaged 0.21 lb VOC/ton and was able to achieve 0.15 lb VOC/ton over four quarters of testing, an emission factor 17 times lower than the default value. Since the facility currently emits around 5 tons per year, we are optimistic that the permit can be amended to fully use the 105,000 tons mix per year capacity of the facility. The local air quality district required and supervised the year-long extensive testing, which was carried out using two methods. The complicated and expensive standard method (SC 25.3) gave very similar results to the less expensive simple hood method (see Figure 5).
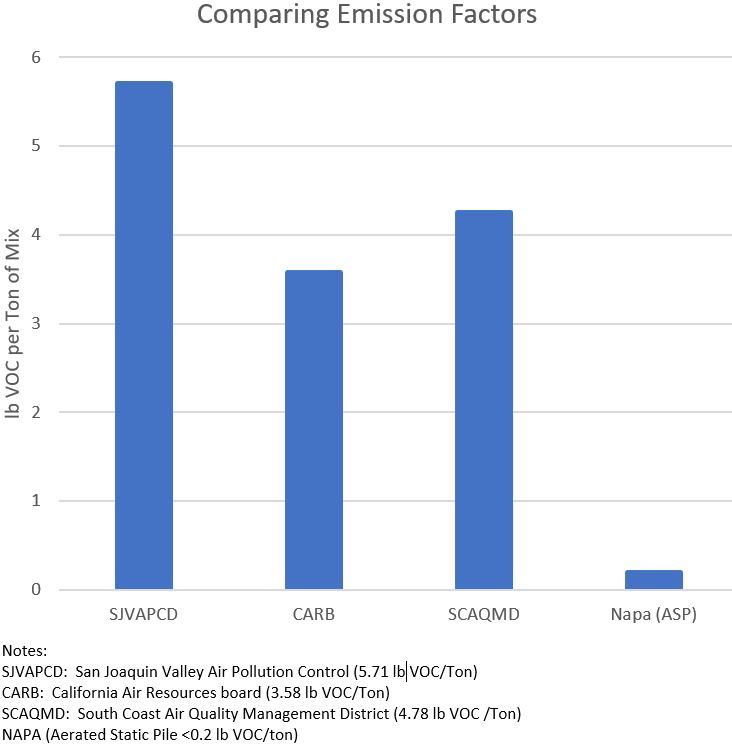
An optimized process can drastically lower emissions. The California facility, using positive ASP, achieved less than 0.2 lb VOC/ton over four quarters of testing. This is the best performance in California public records to date and is the result of maintaining good process conditions in the piles. As shown in Figure 6, the emissions factor for conventional turned windrow projects are much higher. Values can spike up to 30-40 lb VOC/ton in poorly controlled systems.
A well-designed aerated static pile composting facility can help commercial composters meet or exceed regulatory goals for odor and VOC emissions, while incorporating more challenging feedstocks. ECS uses compost science to design for appropriate and sufficient aeration capacity, automated feedback systems that maintain an aerobic system without over-drying, and proper retention time and capacity. This leads to a correctly sized and operated facility that maximizes return on investment. This will be demonstrated in Part 2, which presents an economic analysis of three scenarios: under designed (with or without requiring Emission Reduction Credits), over designed, and optimized design (highly aerated system with automated controls and engineered retention time).
Part 1 (Process Fundamentals Determine Facility Performance) described how we can use process aeration demand testing in the ECS testing lab to optimize the design of a commercial composting facility. Testing optimizes the design for aeration capacity, aeration rates, and retention times for a particular feedstock.
Part 2 demonstrates how an optimized design can produce the best internal rate of return (IRR). We will compare three Aerated Static Pile (ASP) designs/four scenarios (under designed, under designed with purchase of emission offset credits required, over designed, and optimized) meeting a typical example of goals for a hypothetical compost facility.
In this economic analysis, our hypothetical compost facility must meet these typical design goals. Every project will have different values, but this model illustrates the relative value of ‘right-sizing’ a system.
Table 1 describes the three ASP designs used for this analysis.
| Scenario | Design Basis | Risk | Failure Criteria | Remediation |
|---|---|---|---|---|
| Under Designed Example: pipe-on-grade aeration with time-controlled fans creating poor process conditions | Rule of Thumb or Regulatory Stipulation | Under designed system, inadequate process control | Fails VOC or Stability threshold | Run at reduced capacity or purchase offsets (ERCs) |
| Over Designed Example: highly aerated positive aeration system, automated control, non-engineered retention time | Rule of Thumb | Over designed system, excess infrastructure | None | None |
| Optimized Example: highly aerated positive aeration system, automated controls, engineered retention time | Optimized Design | Low | None | None |
In an under-designed compost system, emissions of VOCs are not well controlled and may vary widely. In this analysis, we will assume a conservative Emission Factor (EF) of 3.56 lb VOC/ton of feedstock, but emissions can get much higher, as discussed in Part 1. We will further assume that the top foot of the pile will provide 40% VOC scrubbing (“biolayer cover surface effectiveness”). Surface irrigation and evaporation cool the top layer of the pile, allowing it to act like a mini biofilter. Scrubbing is hard to measure but is estimated to be around 25% to 60%. We will use 40% for this analysis.
Given a 3.56 lb/ton EF, reduced by 40% for biolayer effectiveness, and a 10 ton per year permit, the under-designed system must limit throughput to 9,000 tons per year or else pay for Emission Reduction Credits (ERCs). Due to limited availability and increasing demand, ERC prices have been skyrocketing. ERC volatility is an additional risk. However, for the purposes of this analysis, we assume a cost of $100,000 per ton VOC for ERCs, which leads to an addition cost of $8.0 million per year to process all 75,000 tons of feedstock.
An over-designed system will have no problem meeting the design goals, but the facility will tend to be larger than needed for retention and require more expensive controls compared to an optimized system. A larger facility may also lead to more stormwater treatment. We assume an installed facility cost of $4.5 Million for an under-designed system, $6.1 Million for an over-designed system, and $5.0 Million for an optimized system.
For all designs, the following values were assumed: $35/ton tipping fees, $10/ton sales, operating expenses of $25/ton.
Table 2 shows the results of the economic analysis. The optimized scenario delivers the best IRR by a considerable margin. In our hypothetical analysis, the under-designed facility had a 1% 10-year IRR with purchase of ERCs and was unable to break even if running with reduced capacity. Given the volatility of emissions from this design and cost of ERCs, such a facility could potentially run at a loss even with purchase of ERCs.
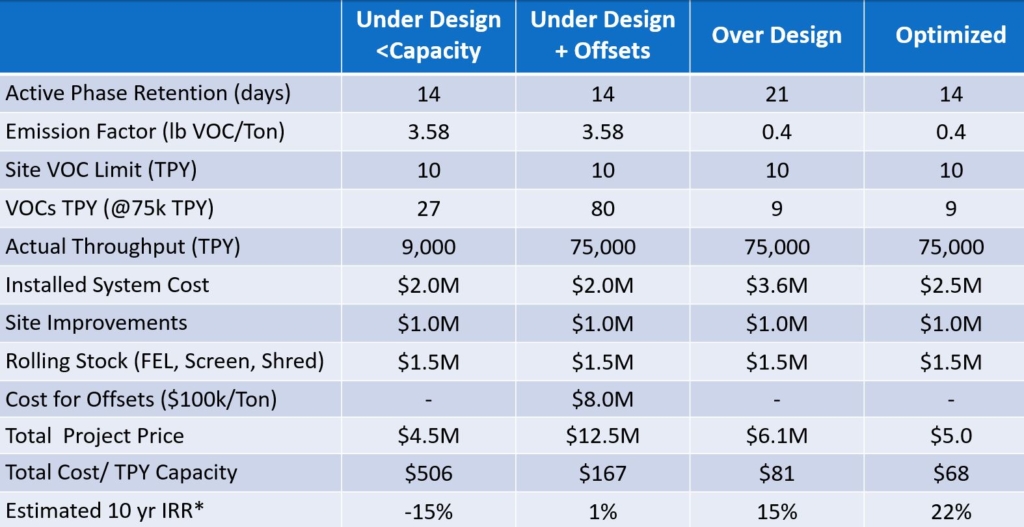
The over-designed facility had a 15% 10-year IRR, while the optimized system had a 22% 10-year IRR. An optimized system will have lower retention time, minimize the VOC emissions generated, and minimize the ERCs required. Capital costs, while more than an under-designed system, will be for the correctly sized facility. Even given the assumptions above, these values are +/- 10%.
ECS can provide composters with optimized, science-based designs for commercial composting facilities. The facility will be sized correctly, costing more than an under-sized and under-designed facility but less than an oversized facility built on rules of thumb. The facility will provide sufficient aeration capacity with automated feedback systems to minimize retention time, VOC emissions, and ERCs. Such a design is neither “too big” nor “too small” and leads to a “just right” system with the greatest internal rate of return.
