Mitigating compost odor, and public perceptions of it, is one of the greatest challenges that the composting industry faces. The rate of odor emissions, definable as Odor Units (OU)/ton, varies widely across the composting industry. To understand what accounts for the broad range of OU/ton at different composting facility it is essential to understand the biology and chemistry of the composting process. This article outlines the biological conditions that drive odor generation in a compost pile, the movement and perception of odors, and how system design and operations can minimize the generation and release of fugitive odors.
Composting is a biological process. The diverse microbial communities present in composting feedstocks colonize, consume, and metabolize the organic compounds in the feedstock mix in a process called bio-oxidation. These microbes are aerobes, meaning they must consume oxygen to survive. These aerobes live exclusively in the liquid films surrounding the feedstock particles, “breathing” the oxygen that dissolves into the film (Figure 1). As they respire inside the liquid films, they consume the organic matter around them for energy, converting degradable organic compounds to carbon dioxide CO2, water vapor, and heat, in a bio-oxidation process. With an optimized process and thriving aerobes, these byproducts are not odiferous.
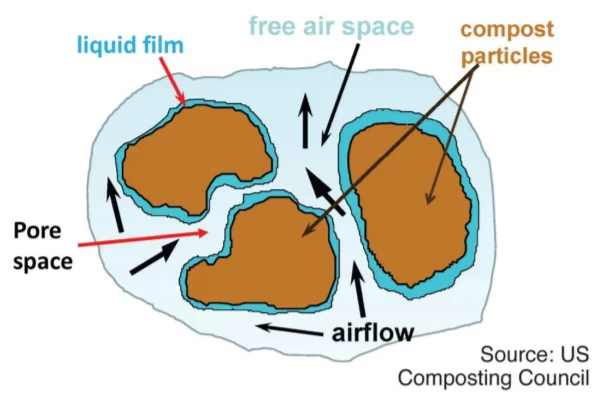
However, if aerobes become oxygen starved, then another category of microbes dominates. The microbes that thrive in oxygen-devoid or anaerobic environments are called anaerobes, and the by-products of their respiration are an array of volatile organic compounds (VOCs), acids, and heat. Anaerobic respiration is one of the main pathways for odor generation in a compost pile.
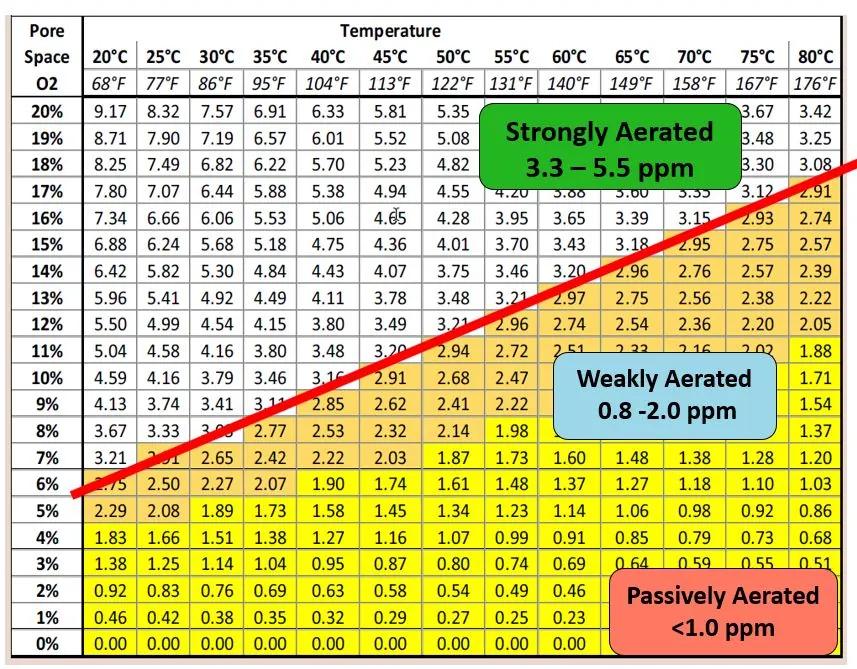
For aerobic compost microbes to continuously thrive, dissolved oxygen levels in the liquid films surrounding compost particles must remain above 3% (Nick Sauer, 2013). The concentration of dissolved oxygen in liquid film is determined by the oxygen levels in the pore spaces (the “empty” air-filled areas between particles) and temperature. As bio-oxidation occurs, heat is released by the microbes and the temperatures in the piles rise. These temperatures are essential for destroying weed seeds and pathogens, but warmer liquids cannot hold as much dissolved oxygen (ppm), per Henry’s Law. As Figure 2 illustrates, only compost piles with modest temperatures and high pore space oxygen availability (typically achieved by strong aeration) will maintain sufficient concentrations of pore space oxygen and dissolved oxygen throughout the active phase.
The active, or primary phase of composting is the most critical phase for aeration. In the first 2-4 weeks of a compost piles’ processing life, the feedstocks are rich in bio-available volatile solids (BVS) that need to be broken down by aerobes before they release odors. If adequate oxygen and moisture levels are available to the microbes, the pile will experience a predictable pattern of temperature change, illustrated in Figure 3. The feedstocks, arriving at ambient temperatures, start to heat up as mesophilic microbial communities grow in the piles. These mesophiles release heat, and once the pile temperatures starts to exceed ~45°C (or ~100°F), the mesophiles are overtaken by thermophilic – or heat loving – microbes. These thermophilic organisms continue demanding oxygen and BVS until they run out of biologically available carbon or are inhibited by excessively high temperatures (~70°C+). When the thermophile populations die back and the pile cools, re-entering the mesophilic temperature range, it indicates that the most volatile organic compounds in the pile have been bio-oxidized successfully. In the maturation phase, communities of microbes and fungi work to further break down plant fibers and make certain nutrients more available once land-applied. Figure 3 shows the typical progression of microbes on the time-temperature curve of an optimized compost process.
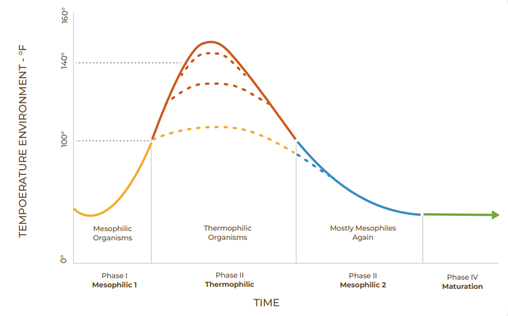
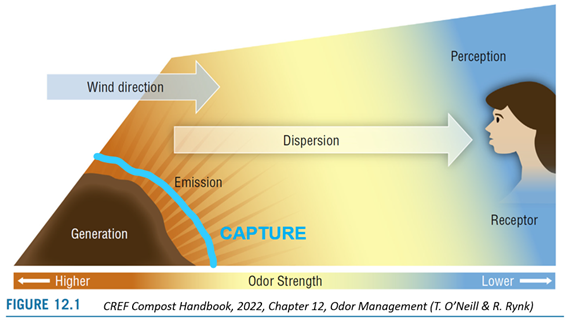
Figure 4 illustrates the steps in the lifecycle of compost odor:
• generation (from anaerobic decomposition or volatilization by heat),
• emission,
• dispersion,
• reception.
Dispersion reduces odor strength as it travels farther from the source. Capturing and scrubbing compost odors will reduce their strength at the point of emission, but not as effectively as reducing odor generation in the first place.
The standard metric for measuring odor concentration is Odor Units (OU). OUs are most frequently determined using a method called dynamic olfactometry, where a diluted sample of an odorant is presented to a panel of human noses at very low concentrations. When half of the panelists can detect the presence of an odorant, the concentration of the odorant at the point of detection becomes one OU. At any composting facility, the fugitive odor flux (total quantity of odors that manage to leave the site, measured in OU/min) is represented by multiplying the per-ton odor generation rate by the tons of compost feedstock being processed and then reducing that flux by the capture efficiencies of the biolayer and/or biofilter. This relationship is shown in Figure 5.

Note that non-bioavailable Volatile Solids (VS), fiber (like cellulose or lignin), ash and water do not produce odors since they do not get bio-oxidized. As Figure 6 demonstrates, BVS is only a portion of feedstocks that the microbes will be able to “eat” as a source of energy in the bio-oxidation process.

Compost processes which inhibit the bio-oxidation process, such as insufficient oxygen, low pH, or excessively high temperatures (>65°C), will tend to increase VOC production. Most, though not all, VOCs are odiferous, so the more VOCs that are made in the pile, the higher the odor flux will likely be.
Some feedstock types are also more pre-disposed to generate odor thanks to inherent chemical properties. Some feedstocks, like pine needles may produce, for example, detectable levels of pinene that can be smelled when the feedstock is actively composted. Manure and biosolids feedstocks often have an inherent ammonia-type odor. The odor wheel below shows the diversity of odor categories and their chemical antecedents.
Feedstocks with more odor potential demand a higher degree of control. To better understand which feedstocks and process types have greater odor risk, ECS has measured odor fluxes from various commercial-sized facilities, illustrated in the table below.
| Ou/min/mT* | Feedstock | Process Control grade |
| 20-100 | Green waste/Yard waste | A (Aerated Static Pile) |
| 200-500 | Biosolids with woody ammendments | A (Aerated Static Pile |
| 1000-1500 | Unamended MSW | A (Aerated Static Pile |
| 250-500 | Green waste/Yard waste | F (turned windrows) |
While far from comprehensive of all feedstock types, the above chart does reflect that compost operations with same feedstocks have significantly less odor flux when paired with better process control (grade A).
Other academic research supports these findings. Researchers such as C. Sundberg, F. Michel, and R.T. Haug have demonstrated that a composting process that doesn’t suffer from low oxygen availability, excess temperatures, or other inhibitory effects will rapidly bio-oxidize while producing minimal VOCs or other odorous compounds such as ammonia or reduced sulfurous compounds. An appropriate feedstock mix, adequate aeration, and highly responsive controls will all work to minimize odor generation.
Process conditions, which refer to quality of the feedstock mix and the availability of adequate moisture and oxygen, largely determine both the rate and the duration of odor generation. An effective aeration system paired with a responsive control system and a successful feedstock mix works to maintain optimal process conditions and minimize odor generation from within the compost pile. Additional capture strategies play a secondary role in odor mitigation after process optimization.
The profile of odor generation from a composting mass is primarily a function of:
• The efficiency of the microbial bio-oxidation process
• The chemical and physical characteristics of the feedstocks
• The retention day (or age) of the batch
The operator created feedstock mix is key to minimizing odor generation at the source. Best Management Practice (BMP) mix guidelines are simple to follow but should be regularly monitored and recorded for overall quality control. A feedstock carbon-to-nitrogen ratio (C/N) maintained between 25:1 and 40:1, are considered ideal, and will ensure the microbes have adequate amounts of carbon to bio-oxidize, without excess nitrogenous compounds available to release intense odors (The Composting Handbook, 2022, pg. 70).
| Key Process Variable | BMP Target | Method | Frequency |
|---|---|---|---|
| Bulk Density | 750-1000 lb/cy | Bucket and scale | Composite sample each batch |
| Moisture Content | Moist not drippy | Squeeze test | 3-4 Grab samples each batch |
| Moisture Content | 52-63% | Lab test to verify squeeze test | Quarterly |
| C/N ratio | 25 | Lab test | Quarterly |
The size of the particles in the feedstock blend helps determine how effective the aeration system will be. ECS-designed aeration systems deliver adequate peak aeration rates for the specific feedstocks to effect cooling and often maintain average oxygen levels above 15%, provided feedstock particles are sized appropriately (bulk density close to 850 lbs/cubic yard, or 1/3 of particles > 1 inch). Feedstocks ground too finely will have insufficient free air space between particles, inhibiting the uniform distribution of air flow (negative or positive) through the piles and compromising bio-oxidation.
Composting is typically best with moisture levels between 45-60%. Operating outside this range tends to inhibit the process. ECS recommends starting a pile on the higher moisture side (55-60%) since moisture is lost during the bio-oxidation process, and this helps avoid running into moisture inhibition at the end of the retention time. Compost mixes that dry out before they have finished primary and secondary composting will struggle to meet satisfactory stability or maturity levels when tested.
Compost piles with a BMP feedstock mix and adequate aeration tend create a brief initial surge of bio-oxidation (measured by increased CO2 and heat production) as microbes consume readily-available compound, which can volatize odorants (mostly organic acids) inherent in the mix (Figure 7). This is followed by a longer period of slower composting, as the microbes continue consuming the more complex organic compounds. While the timeline for these reactions will vary by feedstock, almost all of the analysis we’ve seen shows a similar multi-phase profile. All ECS aeration systems aim to optimize bio-oxidation throughout primary composting by providing highly responsive levels of aeration based on continuous temperature feedback.
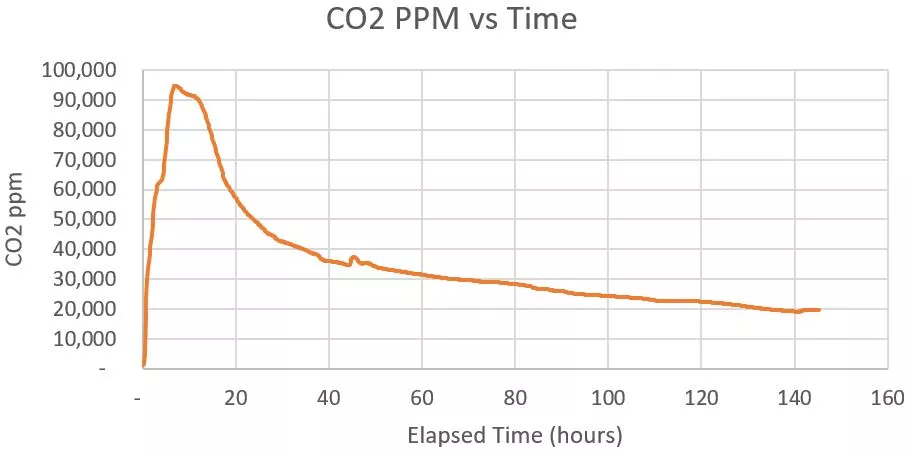
Peer reviewed research, ECS lab work, and ECS’s experience at major composting facilities demonstrates that an effective and relatively short active composting phase in an aerated system leads to low air emissions not only during the primary phase, but also from the subsequent curing and storage phases. Relatively stable compost produces low odor fluxes, because the BVS has been consumed by the microbes and is unavailable to produce odors later on.
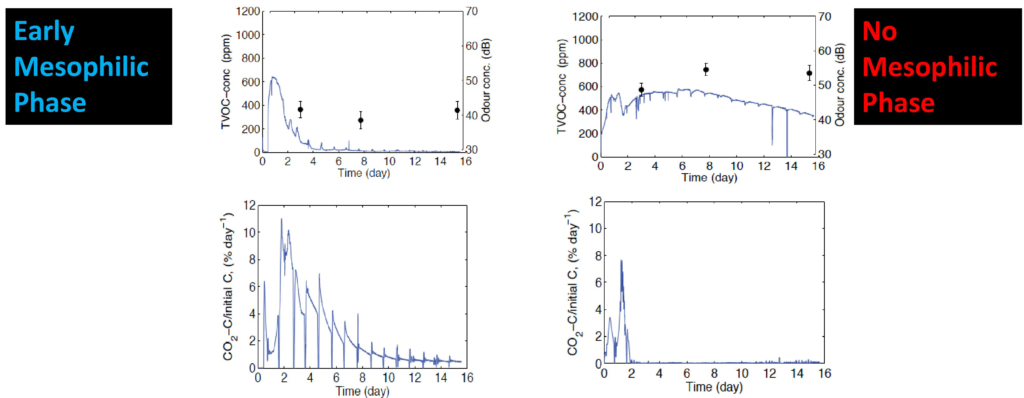
Many feedstocks encountered by commercial processing facilities arrive acidic. Low-pH, high-acidity feedstocks have a close relationship with lifecycle odors from a composting pile. This is because acidity inhibits thermophilic bacteria from thriving, thereby impeding the bio-oxidation of VOCS, and preventing stabilization. Research into this issue by Dr. Celia Sundberg has indicated that there is a very simple remedy for high-pH feedstocks: maintaining an early mesophilic period (<45°C) for long enough that the mesophiles can consume the acids and leave the thermophiles with a neutral feedstock (Sundberg, 2007).
The graphs in Figure 8, below, published by Dr. Sundberg, illustrate this. In the graphs on the left, the compost maintained an early mesophilic phase (<°45C), had high levels of bio-oxidation (shown in the CO2 graph), and relatively lower levels of VOCs (and presumably, odors). In the graphs on the left, we observe the effects of a feedstock blend that bypassed an early mesophilic phase and entered the thermophilic phase with a much lower pH. Less bio-oxidation occurs, and significantly more VOCs are emitted. We can also infer that the inhibited active-phase composting will delay stabilization, creating the risk for long-term odor emissions.
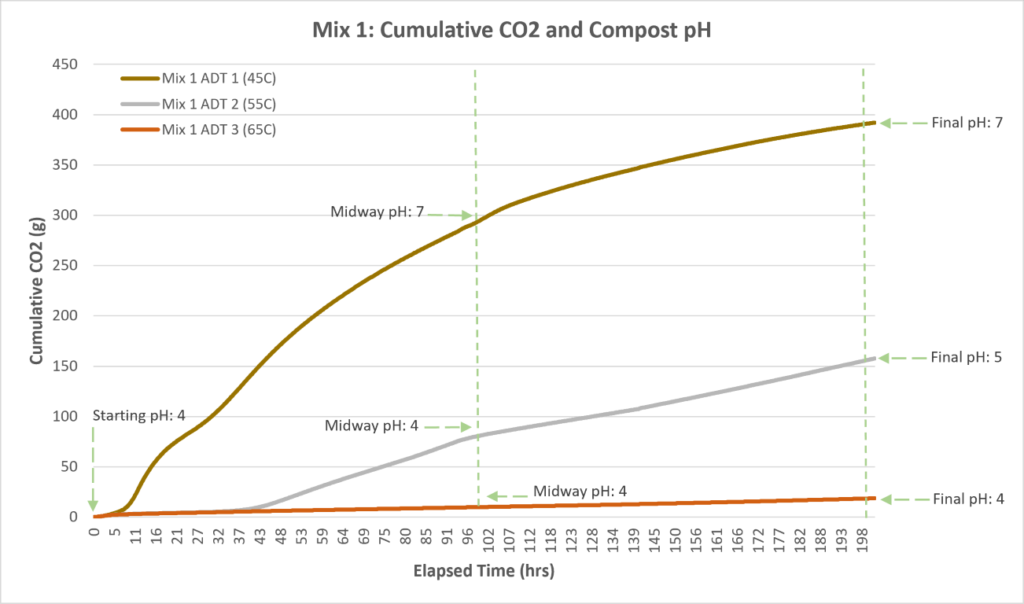
ECS replicated these results in our compost process lab. The graph in Figure 9 shows the difference in CO2 generation (bio-oxidation) over time for a mix of 75% green waste and 25% food waste composted under three different sets of process conditions. All three had BMP mixes and high oxygen availability in the film layer (>3ppm). As noted, they all started with low pH (4), but only ADT 1 provided a cool, early mesophilic period (<45°C, 2.5 days). The early temperatures in ADT 2 and ADT 3 were 55°C and 65°C, respectively.
The high rate of bio-oxidation in ADT 1 generated a large amount of CO2 and achieved a Solvita CO2 Index of 6.0 in less than 9 days, while ADT 2 and ADT 3 both had a Solvita CO2 Index of <4.0 after 9 days.
However simple this solution to low pH may appear, it isn’t always easy to achieve. It can be difficult to keep a fresh compost pile’s temperature in the mesophilic range at the start. Having a strong aeration system, sufficient mix porosity, and responsive controls can all aid in maintaining an early mesophilic period and reducing odor flux throughout the early phases of composting.
The VOC emission profile of a pile with optimal processing conditions can look similar too the bio-oxidation curve (Figure 10). During the first few days of composting, pile temperatures rise, air (positive or negative) is forced through the pile, and the VOCs that are released get carried into the hot exhaust stream. Recent research by Dr. Tom Jobson of Washington State University measured this repeatedly in the hot exhaust captured from the bottom of negatively aerated piles, covered with a biolayer. The compost mix in his experiments consisted of approximately 25% food waste and 75% green waste, by weight. A compilation of this data, shown in , demonstrates how the VOC emissions peak in the first few days, then decrease rapidly under good process conditions (Jobson, 2020). This supports Sundberg’s conclusions and reflects a very similar outcome to the optimized process VOC graph, below.
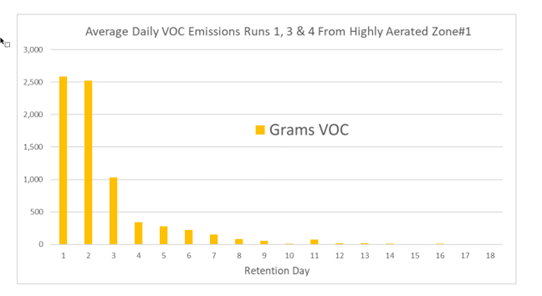
The fact that the bio-oxidation (CO2) curve and VOC emissions curve are so similar reinforces the point that they are connected biological processes. Moreover, it shows that a good feedstock mix paired with early, strong aeration can effectively move compost out of an odor-generating phase quickly, often in only a few days. Most operators would be relieved to know odor risk can significantly diminish after the first 4-7 days.
In addition to designing aeration and control systems to support optimized process conditions which generate low odor, we can also incorporate technologies which further capture and scrub odors. Below, we outline how odors can be captured and scrubbed in a variety of ECS built systems.
Biofilters: Biofilters are typical features of systems that run negative, reversing, or in-vessel aeration. Biofilters are composed of layered organic media that is kept relatively cool and moist. As the air from piles is exhausted into the biofilter media, the VOCs and odorants in that exhaust dissolve into the relatively cool, moist media. Bacteria living in the biofilter media then further bio-oxidize the dissolved compounds. The odor scrubbing efficiency of the biofilter is a function of inlet concentration of odorants (number of odiferous gases entering the biofilter), the temperature and moisture of the biofilter media, and the contact time of the air in the media. A biofilter comprised of appropriate media that is kept cool and moist will have a much better scrubbing efficiency than one that is hot or dry. Additional information on biofilter design and science can be found in this White Paper.
Biolayers: Biolayer are composed of approximately 6-12 inches of pathogen free compost material that is layered on top of an active pile. Biolayers serve as the primary odor capture mechanism in a positively-aerated pile. Like with a biofilter, the scrubbing mechanism is the absorption of odorant gases into a wetter, cooler liquid film layer present in the biolayer media. Dissolved gasses are bio-oxidized in the biolayer by aerobic bacteria. In a biolayer-covered CASP, the air flow rate through the biolayer is generally 5 to 10 times slower than the airflow rate through a biofilter. However, a biolayer is only about one-fifth the depth of a freestanding biofilter, so the slower moving air is essential for getting good scrubbing performance of the biolayer. The odiferous molecules must spend enough time in contact with moist biolayer particles to be captured/dissolved by them. Biolayers have the additional advantage of being cooled by ambient evaporation and continually wetted by condensation from within. This effect can be boosted with the addition of surface irrigation. ECS systems include automatically controlled surface irrigation for the operator to use.
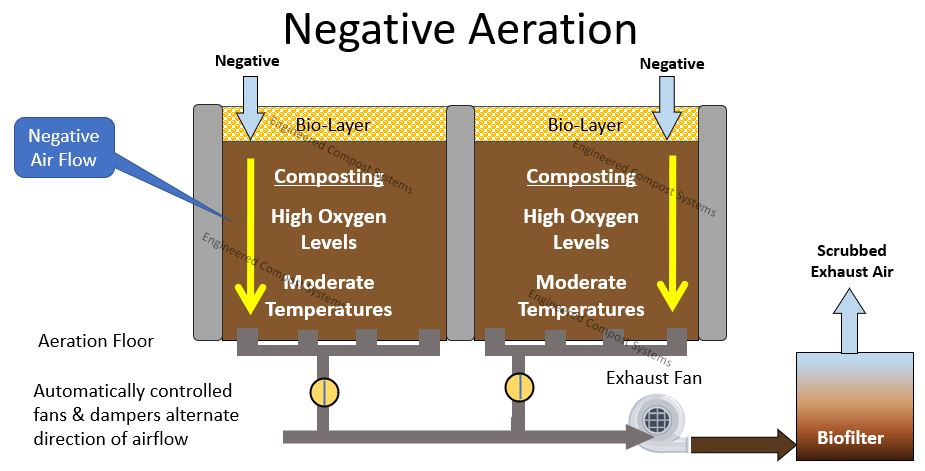
Negative Aeration – Systems featuring negative-only aeration aim to discharge 100% of captured exhaust air to the biofilters. Many negative-only systems feature biolayers for insulation to meet PFRP temperatures, but the force of the negative fans moves effectively all emissions down through the pile and out to the biofilters. Depending on the porosity, moisture, and temperature of the biofilter, emission capture efficiencies of 80-95% are expected.
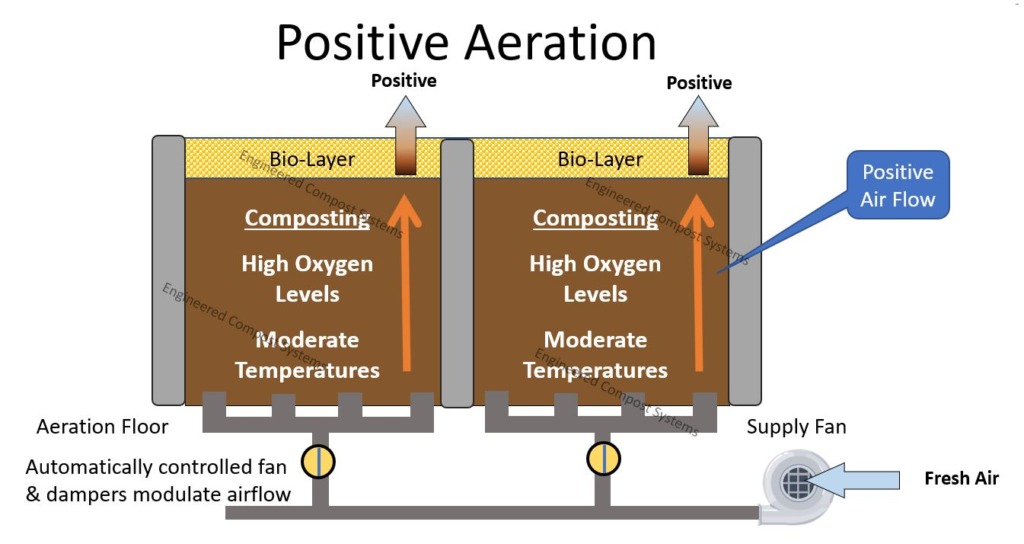
Positive Aeration – Systems featuring positive-only aeration rely fully on biolayers for emission abatement. A well-applied, well-maintained biolayer that is kept cool and moist can be expected to capture 20-90% of emissions. 70% capture efficiency is generally considered a fair estimate of performance.
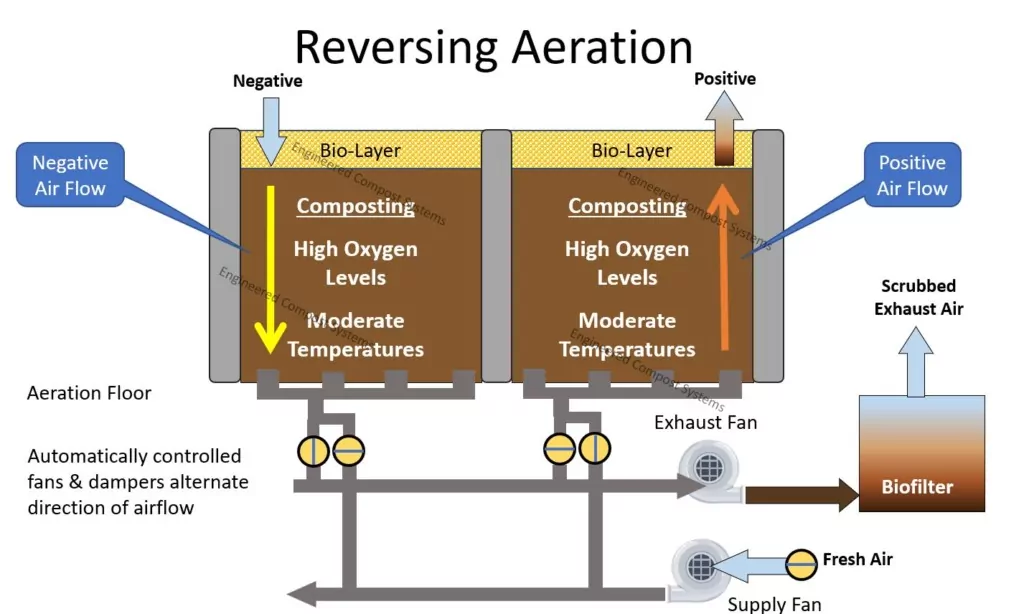
Reversing Aeration – Reversing Aeration systems employ both positive and negative aeration, thus both biofilters and biolayers for VOC/odor capture. When the fans are positively aerating the pile, 100% of the capture is being done by the biolayer. When running in negative, all exhaust air is directed towards the biofilter. Reversing systems offer operators better aeration and process control, helping to keep pile temperatures in a more optimal range, and the risk of odor events low.
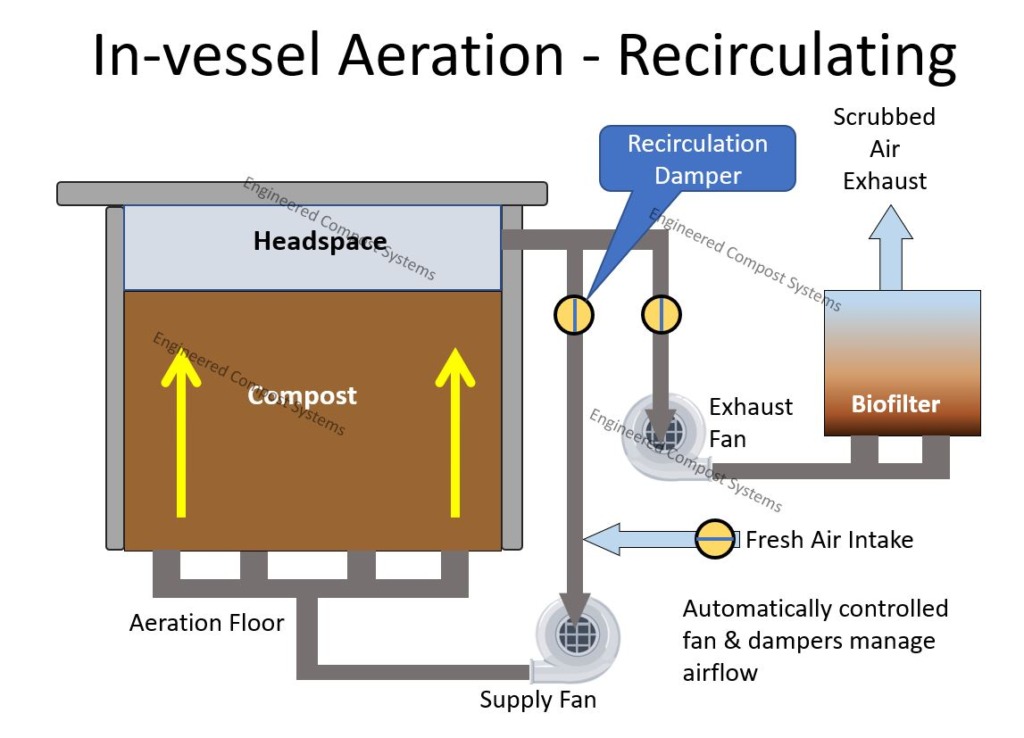
In-Vessel Aeration – In-vessel systems are typically selected for their benefit in managing precarious feedstocks or sensitive public environments. In ECS-designed vessels, the piles do not have biolayers, but they do have biofilters. Positive air enters the vessels at the bottom of the piles, and travels into the headspace of the vessel. This headspace air is exhausted out of the vessel, with part of it going directly to a biofilter for scrubbing, and part of it going back into the pile, mixed with fresh air. This helps to minimize odor flux, retain heat, and keep feedstocks well-oxygenated to reduce odor generation during composting.
The chart below summarized the capture mechanism of the four aeration systems mentioned above.
Technology % capture of exhaust air in Biofilter % capture of exhaust air in Biolayer % Scrubbing efficiency
| Aeration Technology | % Capture of exhaust air in Biofilter | % Capture of exhaust air in Biolayer | % Scrubbing efficiency |
| Positive Aeration | 0% | 100% | 20-90% |
| Negative Aeration | 100% | 0% | 85-95% |
| Reversing Aeration | 50% (approx.) | 50% (approx.) | 62.4-92.5% |
| Recirculating Aeration | 0% | 100% | 85-95% |
A recent source test at a large compost facility utilizing reversing aeration revealed a surprising result: VOC emissions from the pile surface during positive aeration were lower than emissions from the biofilter scrubbing the same air in negative aeration. Remarkably, this occurred despite the absence of a biolayer or surface irrigation. This finding underscores the potential of reversing aeration with adaptive controls to reduce odors, control emissions, and improve composting outcomes. Furthermore, this condition gives insight into pile thermal management, which can be integrated into the biological process design.
Take aways: Reversing aeration with adaptive controls reduces odors by:
Compost Temperature and Odor Dynamics
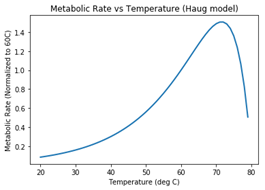
Pile temperature directly influences odor emissions and VOC behavior. The peak metabolic rate, or the range of temperatures where microbes are most active, tends to be between 50-70°C (our lab testing indicates this varies based on feedstocks, though we generally observe a similar curve to Haug’s). Sustained temperatures in excess of 70C will begin to kill off beneficial compost microbes and the heat is sufficient to volatilize organic compounds.
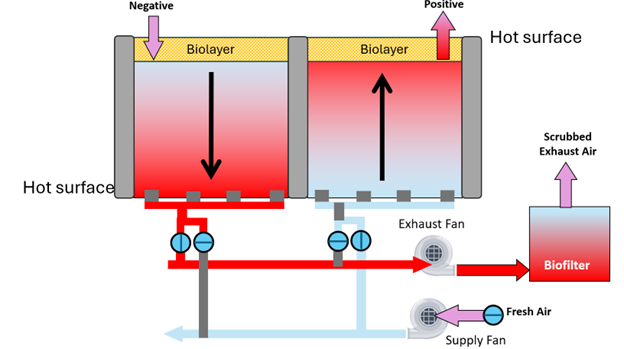
In an application with single direction airflow, the pile is hottest at the exiting surface (could be top or bottom of pile).
Remember to back to Figure 2 (above), which shows the solubility of oxygen in water? The same concept applies for other gasses, including VOCs. . At cooler temperatures, more oxygen can dissolve into the liquid mass. At hotter liquid temperatures, the inverse is observed. Volatile organic compounds will have different solubilities at a given temperature than oxygen, but follow a similar trend. In general, we want cool temperatures to promote both higher levels of dissolved oxygen for microbes, and higher levels of dissolved VOC’s for odor reduction. VOCs that are dissolved are then bio-oxidized by the microbes in the pile.
Put simply, maintaining a cooler compost surface reduces VOC release and odor strength, as VOC concentration is directly proportional to odor intensity.
When fans start aerating a compost pile, they start building a thermocline. A thermocline refers to the temperature gradient within a pile. A standard trend in thermoclines is that the warmest part of the pile is where the air is exhausted, and the coolest part is where the air in injected. Reversing aeration alternates the direction of airflow through the pile by alternating dampers connected to supply and exhaust fans. This process reduces the thermocline, resulting in:
The arrows in the figure below indicate direction of airflow. As cool ambient air particles move through the pile, they gain heat (both sensible and latent) from the respiring microbes. As they approach the exiting surface (air exits at the bottom of the pile in negative, top of pile in positive), the air particles reach maximum temperature.
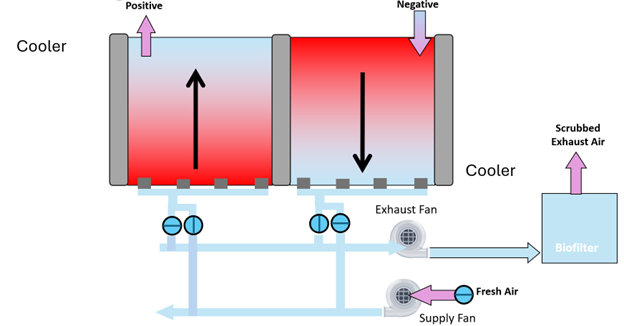
When we change the direction of airflow, it takes time to build the thermocline in the opposite direction. Immediately upon the flip, our process air is no exiting from the cooler surface. While this cool surface will begin changing over time, this delay will vary based on factors such as the pile mass, airflow rate, and metabolic rate. As compost operators with automated controls, we can take advantage of this time delay.
In a recent study of air emissions from a reversing system, the theory of surface cooling reducing VOC emissions was proved. The facility tested runs its aeration with a bias towards negative based on time: 75% of aeration is negative, 25% is positive. For this reason, it does not use a biolayer on top of its piles. The facility does, however, irrigate the surface of all piles to maintain moisture.
The field tests revealed the following:
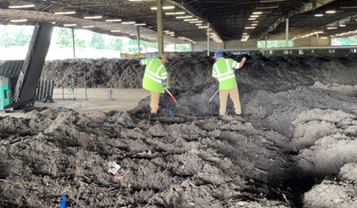
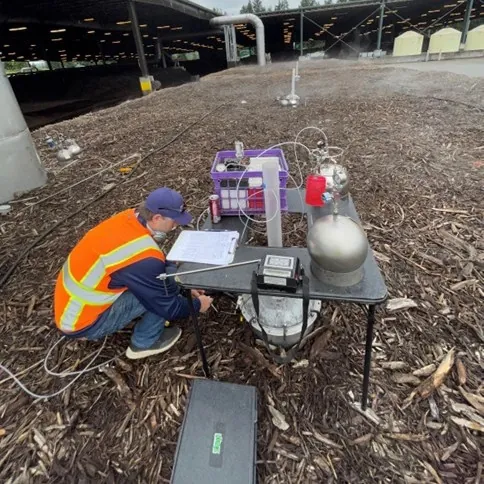
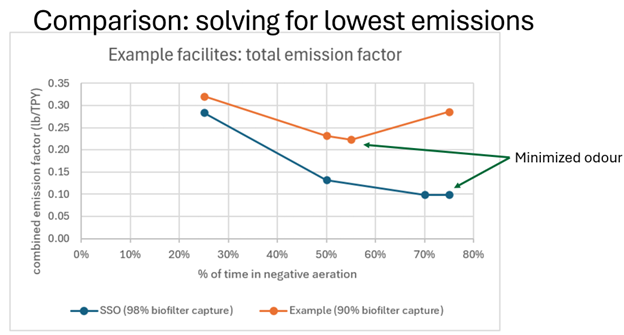
The following tables show an actual facility, and comparison example, and how different fractions of time operating in negative vs positive mode impact the resulting Total Emission Factor. 3.56 lb VOC /Ton is the CARB default factor for green/yard waste composting. Our facility measured 0.11 and 0.08lb VOC/Ton in negative +positive mode respectively, yielding a 97 and 98% ‘theoretical’ reduction from the default baseline.
Other than the measured scrubbing efficiency, I estimate the other top layer scrubbing efficacies, keeping in mind the performance will decrease as the exiting surface become hotter.

In the second table, We hold the top layer scrubbing efficiency constant, but change the biofilter from 97 to 90%. This shows how operating in 55% of the time in negative would achieve a lower Total Emission Factor with this reduced biofilter efficiency. In order to achieve the lowest possible emission factor, minimizing compost odor in the process – we need to know about the pile scrubbing efficacy.

The graph below shows how the resulting curves for Total Emission Factor compare.
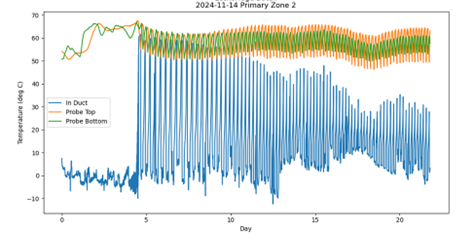
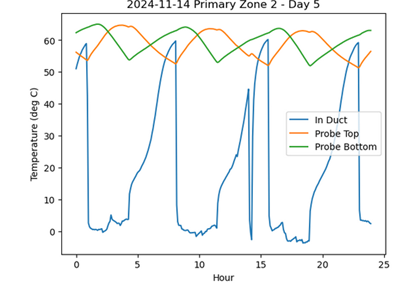
The graph below shows the temperatures recorded in a municipal compost system with reversing aeration. After PFRP is met near day 5, the aeration direction alternates on regular, predetermined intervals. The temperature probe has two sensors at approximately 30” and 60” deep in the pile, which indicate the changing temperatures as we alternate aeration direction.
If we zoom in on a typical day, we can see these probes alternating temperature within about 10°C of each other.
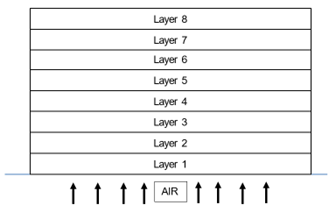
However, recall the layers in Figure 1. At 30” and 60” depth, we would expect the temperature readings to be more similar than at the aeration floor (96”), where the influx of ambient air would have a strong cooling effect. So, it is unsurprising that the duct temperature plummets to near ambient air temp during positive mode.
Interestingly, we see the duct temperature slowly climb back up in negative mode. This makes sense as ~55-65°C air is making its way through the compost pile, gaining heat from microbial activity, and building up the thermocline. After about 4-6 hours, the duct temperature nearly matches the approximate temperatures we see at 30 and 60” depth.
What does this imply about the efficacy of reversing aeration for removing heat from the pile?
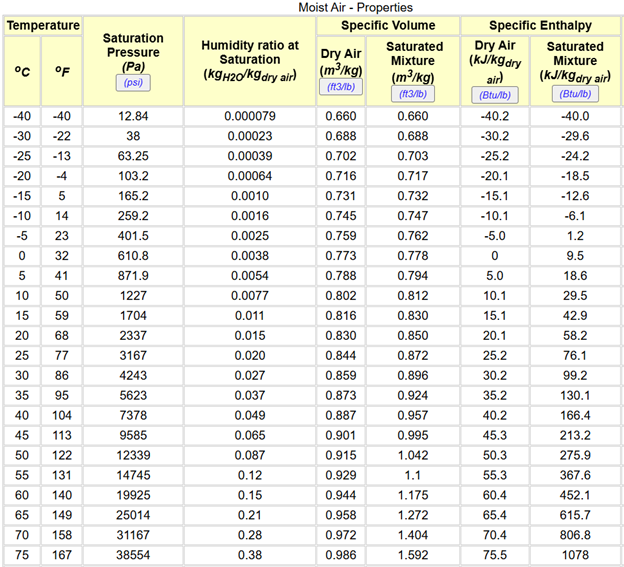
Well, the enthalpy of saturated air at 20°C is about 58 kj/kg. The enthalpy of saturated air at 60°C is about 452 kJ/kg. This tells us that once the thermocline has substantially established itself, there is over seven times the capability to remove heat (energy) given approximately the same airflow. The chart below illustrates various properties of saturated air. It should be noted that warm air has a higher saturation point than cooler air, meaning that the hot air leaving a pile is wetter. The presence of moisture is one of the main factors in increasing enthalpy.
If we need to reduce odors and VOCs, moderate cycling between positive and negative mode can help cool the surface where exhaust air exits. The cooler surface temperature improves gas absorption, thereby reducing VOC’s and odors emitted to atmosphere.
If we need to speed up the biology, more rapid cycling between positive and negative mode will minimize the thermocline, helping more of the material reside at the optimum metabolic temperature.
If we need more heat removal, often the case with energetic feedstocks or during warm conditions, longer cycling between positive and negative allows for more thermocline to build up. The air enters the pile at ambient conditions, and exits the pile saturated at very high temperature and moisture. This enables us to remove more heat per CFM of air.
Reversing aeration with adaptive controls not only enhances composting efficiency by maintaining more uniform temperatures but also offers a compelling solution for odor and VOC emissions . By cooling surface temperatures and leveraging the principles of gas solubility, reversing aeration can significantly reduce VOC emissions while accelerating compost stabilization. Furthermore, reversing technology gives the site operator an additional tool for managing heat removal in all weather conditions.
In addition to designing the system for optimized composting, including tools for capture – daily operation also plays a key role in odor abatement. Daily operations are fundamental in keeping composting odors to a minimum. The steps below outline some of the many possible sources of odors, and how to handle them before issues arise.
Whether it’s biosolids, food waste, green waste, or manure, feedstocks are always delivered with some amount of odorous compounds. Inbound feedstocks can be a source of strong odors if not managed proactively. Most facilities limit the emission of these odors by keeping the surface area of the feedstock tipping pile small, mixing odiferous feedstocks with ground woody material to absorb some of the odors, and/or placing the feedstock mix into an aerated composting area by the end of the business day. Avoiding liquid pooling in/around fresh feedstocks is also essential, as these puddles will have a high level of dissolved compounds with potential to emit strong odors as the liquid evaporates.
Good housekeeping and rapidly moving feedstocks onto aeration can negate the need for enclosing tipping/grinding/mixing facilities, even at locations with odor sensitive neighbors. However, if need be, these activities can be enclosed. In enclosed pre-processing facilities, building air is drawn out of the structure and exhausted into biofilters for additional scrubbing. Here is an example of an ECS-built site utilizing this combined technology.
In aerated static pile composting, there is a risk of odor emissions when the pile is moved from primary (active) to secondary composting. One way to abate this risk is to leave the pile undisturbed in active composting for as long as operations can accommodate (up to 4 weeks) to ensure that the bulk of the VOCS have been bio-oxidized and captured. Next, we recommend that operators thoroughly soak the top of the pile before it is moved. This will do a few beneficial things: 1) This will create a moister surface for any lingering VOCs to dissolve into when the machines dig in; 2) It will help to raise the moisture level of the compost back up to an ideal range so that the biology can continue to thrive and stabilize the compost through the secondary process; 3) This will keep dust levels to a minimum.
For facilities who will do secondary composting and curing in turned windrows, we still recommend all of the above steps. In addition, we recommend using pathogen-free water to periodically moisten the outsides of the windrows to continue to capture dust odors that may present themselves.
Screening will always produce some level of dust and has the potential to release odors if you are screening un-stable compost. We recommend screening compost that is stable (Solvita 6+), and as moist as your screen type will allow.
We also recommend turning and/or screening when the air is moving in a direction favorable to your site. In other words, away from neighbors and not during an inversion layer where odors will linger in the area for prolonged periods of time.
Surface water can play a big role in facility odor production. Different strategies can help mitigate this impact. Generally, water from a compost facility’s operations can be broken into three categories, each with their own odor-mitigation demands:
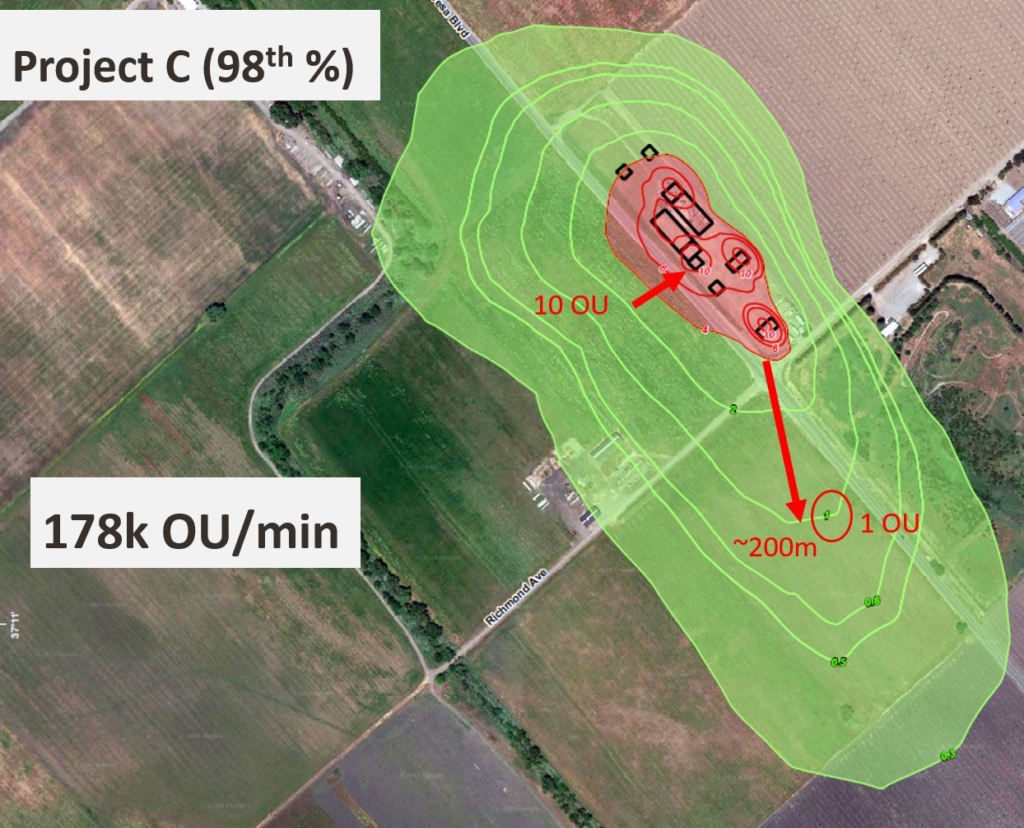
For prospective compost facilities, dispersion modelling can be incredibly useful risk mitigation tool that can inform site design and operations. Dispersion modelling maps the atmospheric conditions around a site to predict how and where odor emissions might flow. The image below shows what an example model could look like. The areas in red have higher expected concentrations of odors (OU’s) than the green rings around it. For the site below, odors were reduced to <1 OU/min within 200m of the facility.
Modelling can help developers quantify what level of odor capture may be required to avoid triggering odor complaints during operation. It can also help during development by informing stakeholders of the future impact of the project.
ECS has an extensive database to provide a most likely range of emissions to help remove the guesswork. We can provide odor analysis and dispersion modeling to quantitatively predict the odor impact from operations.
Compost odor issues can be devastating to facilities who lack the technology and expertise to mitigate them. However, with the right combination of system design, feedstock composition, and operational management, compost odors can be sharply curtailed.
ECS is passionate about helping compost facilities succeed. With our extensive background in compost science and engineering, we have helped many facilities overcome odor challenges. Contact us to learn more.
Citations:
Sundberg, C., “Higher pH and faster decomposition in biowaste composting
by increased aeration,” 2007, https://compostsystems.com/decomposition-rates-with-higher-aeration/
Sauer, N., “Measuring Oxygen in Compost,” 2013, https://www.biocycle.net/measuring-oxygen-in-compost/
Jobson, T., “Emissions from Washington State Compost Facilities: A Review of Volatile Organic Compound Data, and an Estimation of Greenhouse Gas Emissions,” 2020, https://wpcdn.web.wsu.edu/cahnrs/uploads/sites/44/Emissions-from-Washington-State-Compost-Facilities_v18Feb2020.pdf
Michel, F. C., & Reddy, C. A., “Effect of Oxygenation Level on Yard Trimmings Composting Rate, Odor Production, And Compost Quality In Bench-Scale Reactors,” 2013, https://www.tandfonline.com/doi/citedby/10.1080/1065657X.1998.10701936?scroll=top&needAccess=true
Haug, R.T., “Elements of Odor Management,” 2020, https://www.biocycle.net/elements-of-odor-management/
We want to learn more about your project goals. Call or email us to get started.