Food waste is increasingly being diverted to composting facilities that have traditionally managed green waste. Amongst other challenges, the high biodegradability and low pH inherent in food waste have tended to increase the generation of odors and volatile organic compounds and lengthen the time to achieve a stable product. In a series of peer-reviewed publications the compost researcher Celia Sundberg explained the mechanism by which food waste rich (50%) feedstocks inhibit composting and give rise to these issues (Sundberg, 2004; 2008; 2013). Her research found that when temperatures are kept below 40°C for the first 48 hours of active composting the mesophilic bacteria could degrade the organic acids, which in turn allowed the pH to rise above 6.5 (7.0 is neutral) and eliminate the inhibitory effects of low pH.
Sundberg’s work, however, did not look at some of the nuances that come with working with typical source separated organics at full scale. These nuances impact both the design and operation of a facility. Questions that remained to be answered include: What about lower concentration of food waste? How does increasing early phase temperatures over a broader range inhibit biodegradation? What happens if temperatures are allowed to increase to typical high thermophilic conditions after a mesophilic initial period? And perhaps most importantly facility designers, what peak aeration rate is required to provide an initial mesophilic period? The study we report here aims to answer some of these questions.
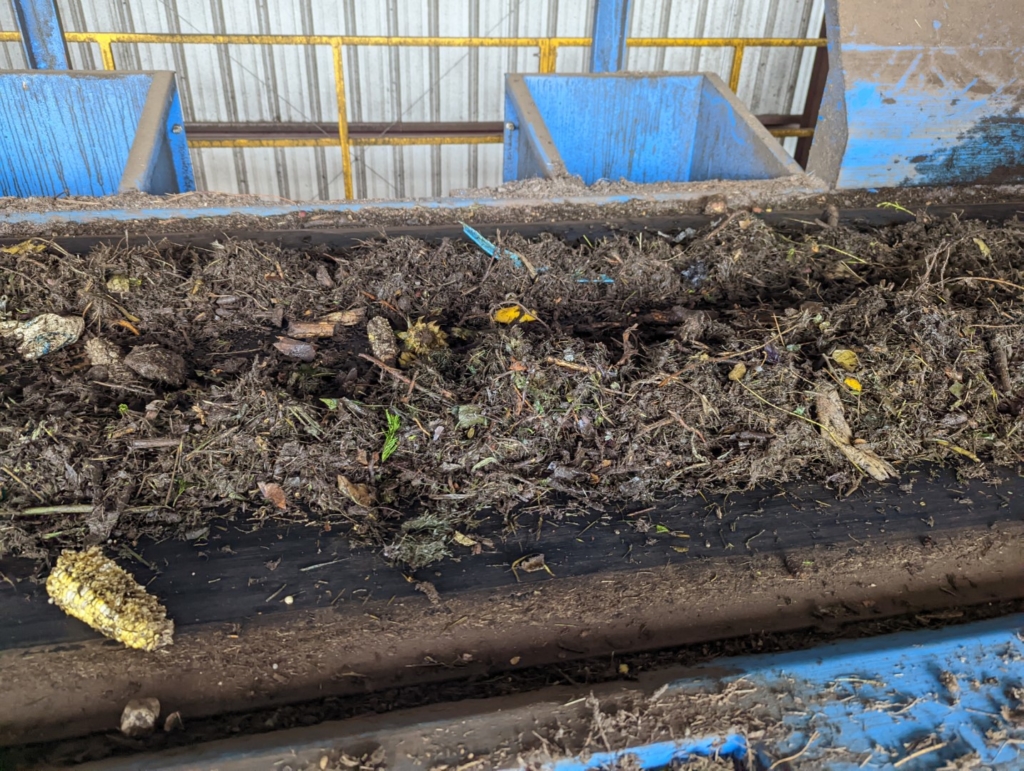
ECS’s Compost Process Lab is equipped with three instrumented Aeration Demand Testers (ADTs) that provide controlled compost process conditions and measure the real-time levels of CO2 and O2 (the primary indicators of composting activity). ADTs aerate a 12-liter feedstock sample while controlling temperatures to within +1.0°C and airflow to within 2% of full-scale. By adjusting the rate of air flow the range of oxygen levels can be controlled as well. Standard feedstock and compost product tests (weight, moisture content, volatile solids, pH, density, and stability) are carried out as needed. These data provide insight on how process conditions and mix characteristics impact the rate of biodegradation.
Each ADT is a sealed stainless-steel vessel nested within another steel vessel containing a stirred water bath that is maintained at a selected temperature. Sensors monitor the temperature in the headspace (T1), compost sample (T2), and in the water bath (T3), as illustrated in the diagram below.
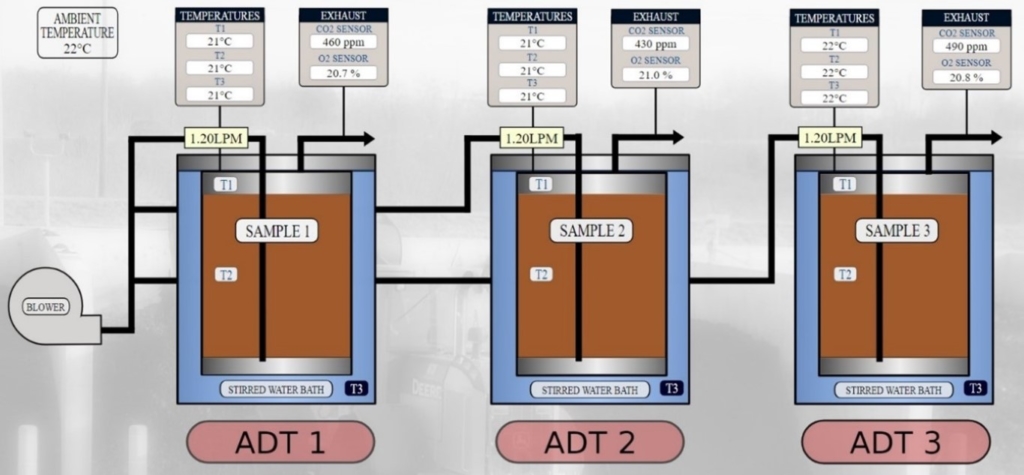
Figure 1. ECS’s Aeration Demand Tester
A series of cooling and reheating coils reduce the relative humidity in the exhaust air prior to exposure to the CO2 and O2 sensors. All sensor data is logged every ten minutes.
Feedstock Mix and Test Conditions
For this trial we created a mix from common acidic feedstocks, food waste and conifer wood waste, to further examine the interaction between pH and temperature in composting process efficiency. The raw mix was created at a ratio of 1:3 food-waste to sawdust by volume and had the following characteristics:

The food waste was comprised of blemished produce from a grocery store (tomatoes, strawberries, melons, and citrus) that was slurried in a food processor. It was amended with relatively fresh course fir sawdust. Water was added during mixing until mix bulk density was approximately 900 lb/yd3 by bucket test, and the “squeeze test” was able to produce a few drops of free water.
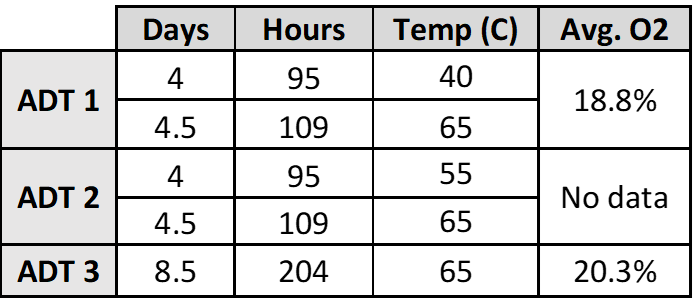
The mix was split into three 4,770 gram samples and loaded into each ADT vessel and aeration and data acquisition was initiated immediately. The samples were exposed to three different temperature sequences over an 8.5-day period as shown in Table 2 below. All three ADT’s were continuously aerated with 22°C room air at a rate of 1.2 L/min. This aeration rate was adequate to keep oxygen levels consistently high; always above 15.3% and averaging 18.8% in even the most active ADT (#1).
ADT 1, 2, and 3 were maintained at 40°C, 55°C, and 65°C respectively for the first 4 days, to examine the difference between mesophilic, moderate thermophilic, and high thermophilic composting temperatures on composting efficiency. At 4 days, the temperatures in ADT 1 and 2 were also adjusted to 65°C to expose the samples to higher thermophilic temperatures that are common in full-scale systems.
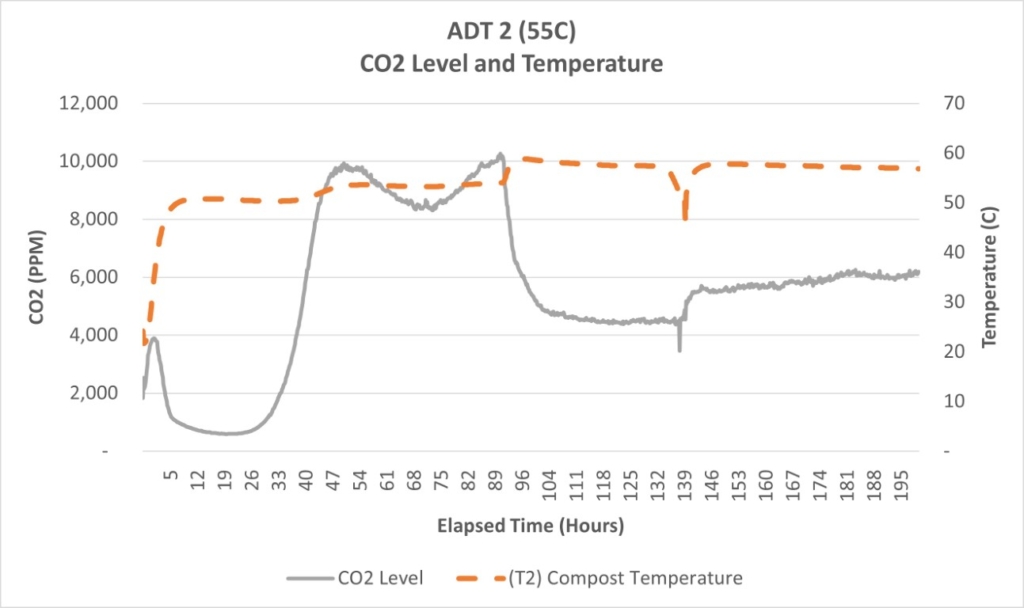
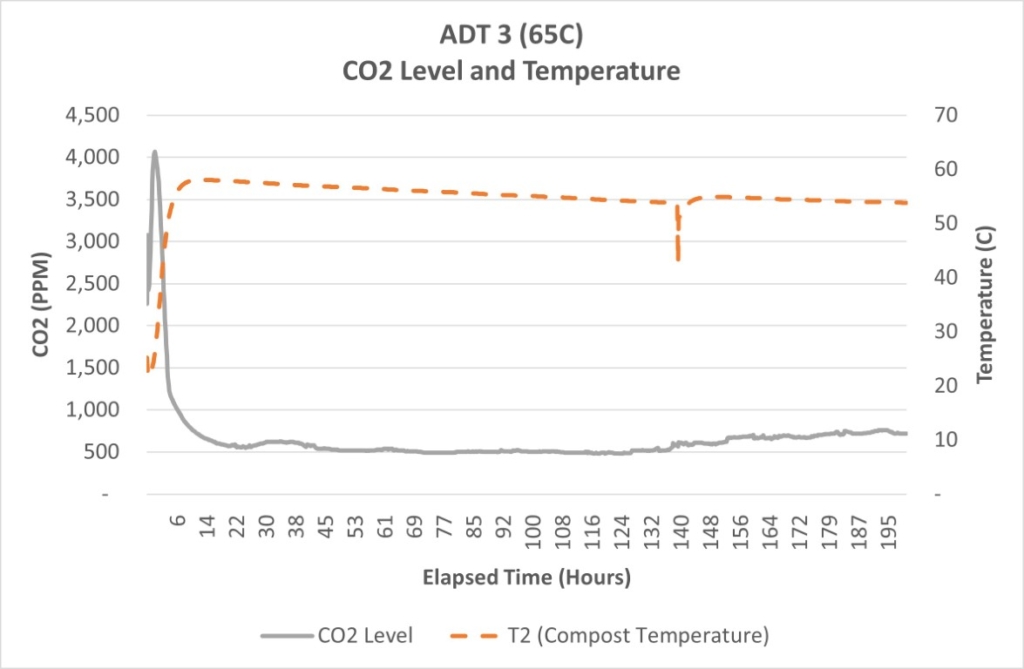
pH in the feedstock mix was measured by saturating a small sample with deionized water, stirring, allowing the mix to sit for about 1 minute, and then inserting color-indicator pH paper strips from Hydrion. Moisture was assessed by weighing wet and then oven-dryings samples at 100°C for 24 hours. Volatile solids (organic matter) were determined using a 550C oven for two hours to combust the dry samples. Stability was assessed using a Solvita test kit at the end of the trial.
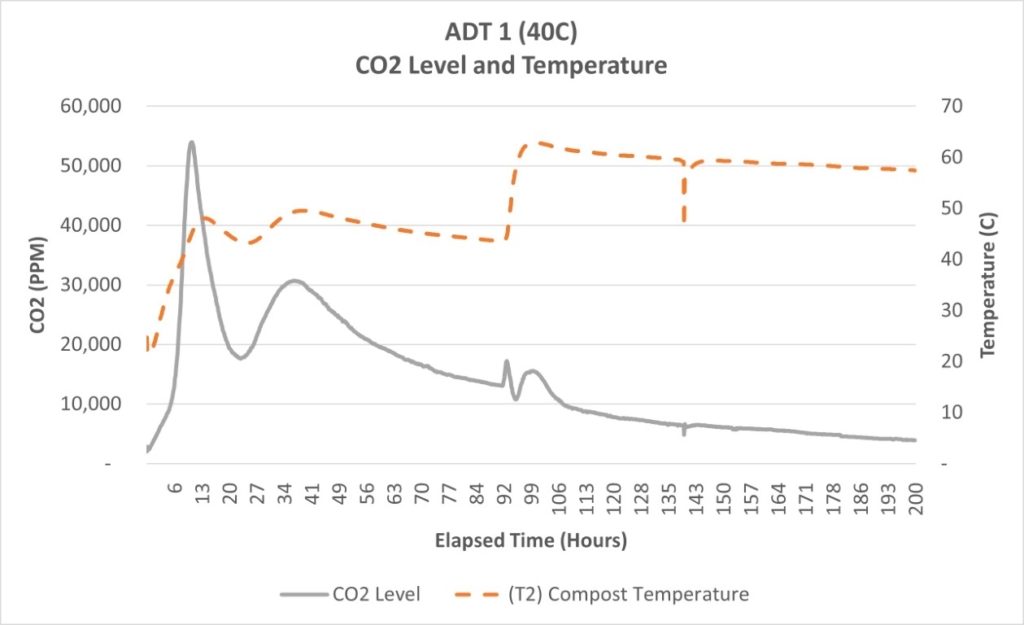
Figure 2 and Table 2 indicate that, for the acidic feedstocks tested, temperature had a strong impact on the rate and the total CO2 evolution during the trial period. ADT 1 (40°C) produced significantly more CO2 both within the first two days, and throughout the test period, than either ADT 2 (55°C) or ADT 3 (65°C). After 40 hours CO2 production from ADT 2 began to increase, but by the end of the trial at 8.5 days it had only produced 40% of the CO2 produced by ADT 1. ADT 3 appeared to be strongly inhibited; by the end of the trial it had only produced 5% of the CO2 produced by ADT 1.
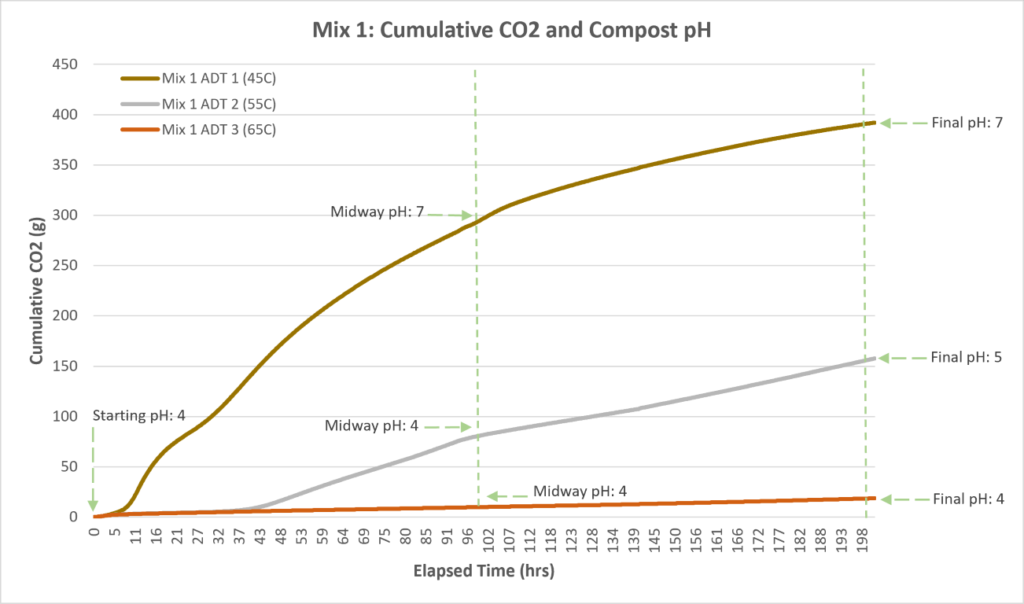

The pH also appears to be affected by temperature and, as shown by Sundberg, impacts the generation of CO2. The mix started at pH 4. After 4 days the mesophilic ADT 1 had reached a neutral pH of 7, whereas the thermophilic treatments remained at pH 4. By the end of the trial the moderately thermophilic ADT 2 increased to pH 5, while the highly thermophilic ADT 3 was still at pH 4.
Table 3 also shows the expected correlation between CO2 generation, pH, and stability measured on the Solvita Index. The Solvita test of ADT 1, an 8 level scale which is a proxy for compost stability, showed an Index of 6 (curing phase). The other two treatments produced Solvita ratings of 3 and 4, for ADT 2 and ADT 3, respectively (still in an active composting phase).
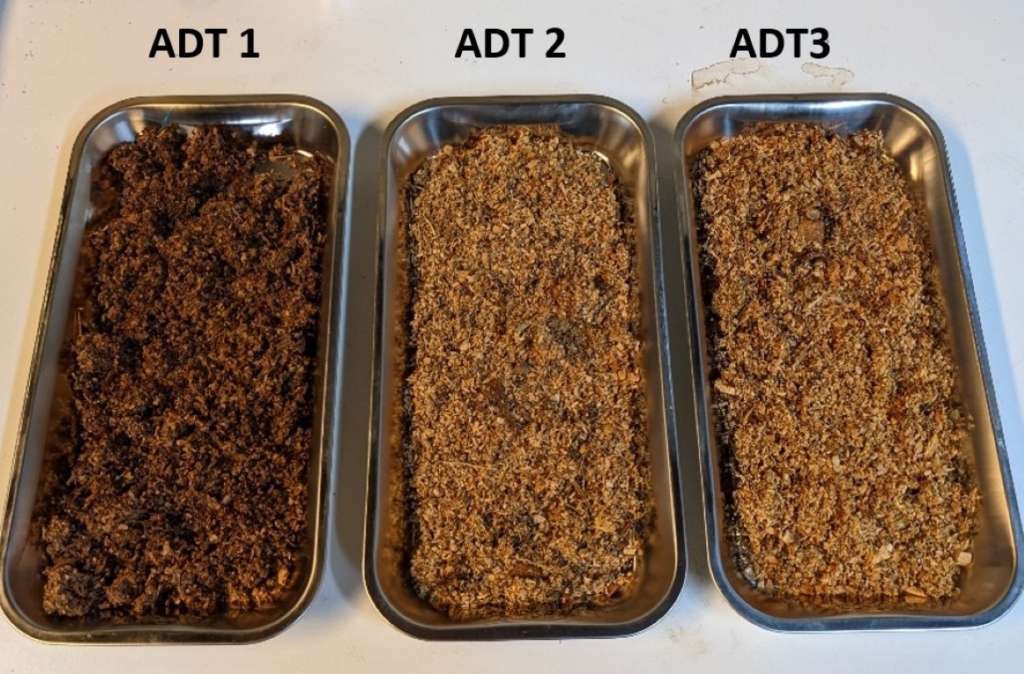
Figure 4 of the samples at the end of the trial show that ADT 1 appeared darker than ADT 2 and 3, which looked relatively unchanged from the raw mix. The material from ADT1 had a very light earthy odor whereas the other samples emitted a sour odor.
An uninhibited active phase composting process produces significantly more CO2, and thus achieves a more stable product much more quickly, than a process that is inhibited by low pH resulting from high initial temperatures. Our qualitative observations, as well as findings in the research, indicate that uninhibited composting generates less odors and volatile organic compounds. When composting acidic waste feedstocks, providing a mesophilic (<40°C) phase at the beginning of the process allows the pH to quickly rise to the neutral range. This pH shift from acidic to neutral appears to not be reversed when temperatures are subsequently allowed to rise significantly higher (65°C). Thus, the benefits of achieving near neutral pH continue through the remainder of the composting process.
These findings should be considered when developing the design and operational plans for food waste composting facilities. The CO2 data generated in the ADT trials provides the basis to calculate unit heat generation (Watts per kg). In Table 4 we use typical ambient air conditions (30°C, 20%RH) and the peak CO2 generation rates during the Mesophilic and Thermophilic phases in ADT 1 to calculate required airflow to match the rate of heat generation.

The calculated result is a very high aeration rate for the mesophilic phase. Typical industry aeration rates vary from 0.2 – 5.0 cfm/cy. Fortunately, the pH shift isn’t reversible; the temperature can be allowed to rise once near neutral pH has been achieved. Once the pH shift occurs, the aeration rates in the thermophilic phase can be drastically down-sized due to both the much lower rate of CO2 (heat) generation following an uninhibited mesophilic phase, and the much higher energy content of the 65°C exhaust air. In practice more effective cooling can be achieved in a 2 – 4 day mesophilic phase by initially building shorter piles that increase the unit aeration rate and take advantage of increased heat loss through convection and conduction by increasing the surface area/mass ratio of the pile. Material could then be combined into standard depth piles for the remainder of the active composting period. The mix used in this trial had a high food waste content (45%). Mixes with a more common food waste content in the 5 – 20% range tend to produce a lower rates of heat generation, but in our experience, they also require higher aeration rates than industry standards to produce a consistent Mesophilic phase.
The results from these trials have provided insights into more efficient composting of acidic feedstocks, but they have also left us with questions on how to further optimize facility design. These questions include: How short can the mesophilic period be? How does reducing the percentage of food waste from 45% in these tests impact the aeration requirement to maintain a mesophilic period?
Sundberg, Cecilia, Sven Smårs, and Håkan Jönsson. “Low pH as an inhibiting factor in the transition from mesophilic to thermophilic phase in composting.” Bioresource technology 95.2 (2004): 145-150.
Sundberg, Cecilia, and Håkan Jönsson. “Higher pH and faster decomposition in biowaste composting by increased aeration.” Waste Management 28.3 (2008): 518-526.
Sundberg, Cecilia, et al. “Effects of pH and microbial composition on odour in food waste composting.” Waste Management 33.1 (2013): 204-211.