The ECS process lab uses aeration demand testers (ADT) to measure real-time CO2 output. This enables us to see how quickly microbes bio-oxidize the bio-available volatile solids during the composting process. However, understanding these bio-oxidation rates is complex. It appears that BVS can be sub-divided into fractions that degrade at different rates to produce an accurate model of bio-oxidation. This is not surprising, given the composting process is a complex mix of different microbes and substrates. This paper shares what we learned from analyzing multiple approaches to fitting bio-oxidation regression curves to model our lab data.
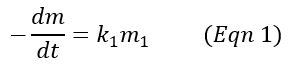
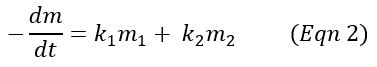
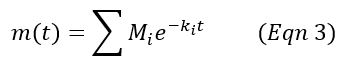
The basic model for volatilization of bio-available volatile solids (BVS) within a compost mix is a single-component first-order differential equation (Eqn 1). In this model, the solids volatilized at a rate, k, proportional to the amount of BVS remaining at time t. As the solids are consumed over time, the rate declines, and other indicators of activity, such as CO2 and heat generation, also decline. A more general version of this model is the multi-component first-order equation (Eqn 2), where the BVS is split into two or more quantities that volatilize at different proportional rates. The solution to this, and also to the single-component model, is an exponential decay equation (Eqn 3).
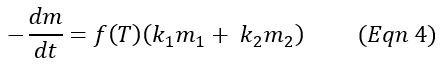
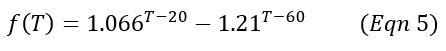
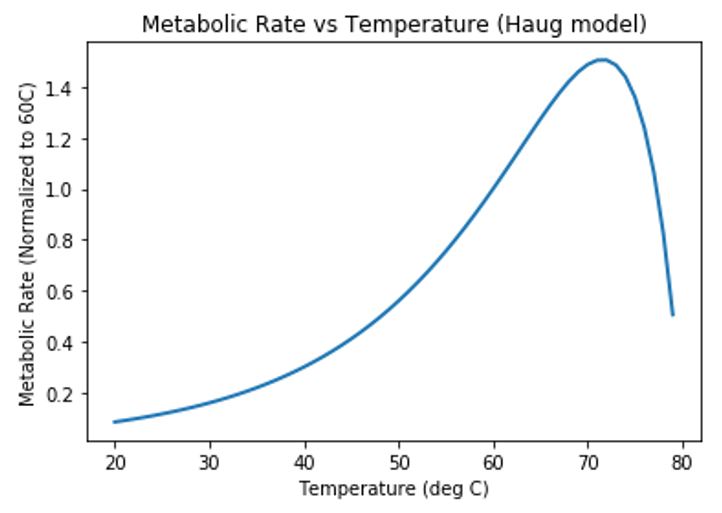
The above equations do not account for factors such as temperature, moisture, pH, mix porosity and heterogeneity, and available oxygen. Equations 4 and 5 show a correction for temperature of the material. Equation 5 is the model presented in Haug. The effect of temperature on volatilization rate according to this temperature model is shown graphically in Figure 1.
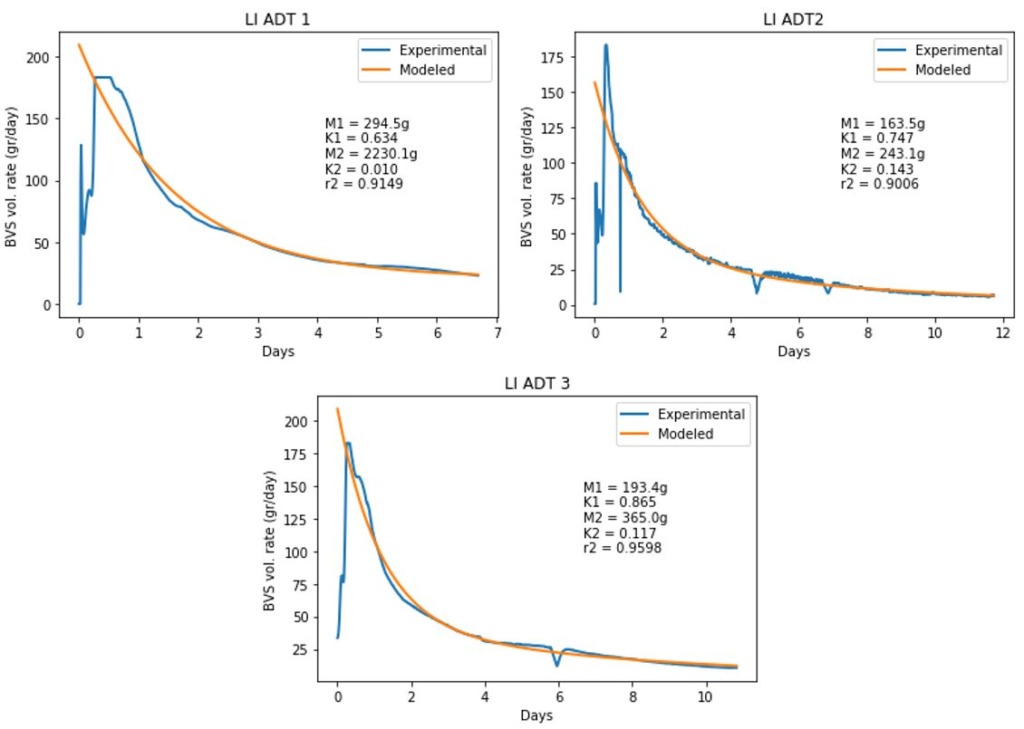
The following graphs in Figures 2 and 3 model data from the ECS process lab. We composted three batches of a digestate, leaf and woody biomass mix to generate the CO2 data. As is often the case, we observed a high initial rate of bio-oxidation, characterized by an initial spike in CO2 production. This was followed by a much slower rate of bio-oxidation as we continued to hold airflow rates and temperature constant.
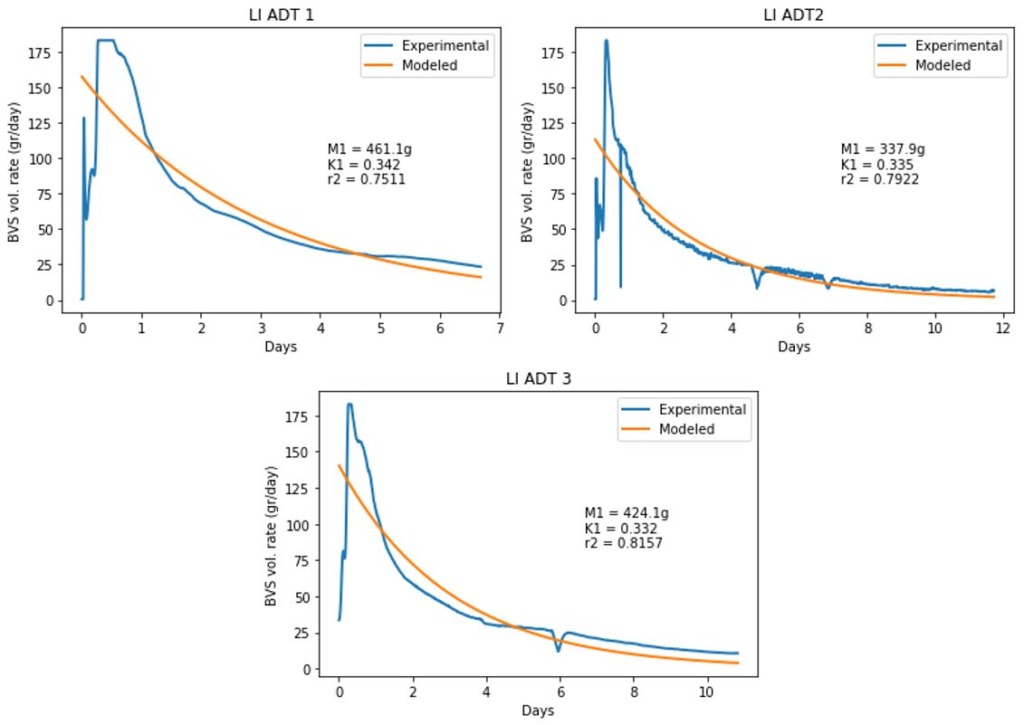
Figure 2 shows a single component model fit to each trial. In each case, the model underestimates both the peak volatilization rate near the beginning of the process and also underestimates the slowly decaying rate that occurs after several days.
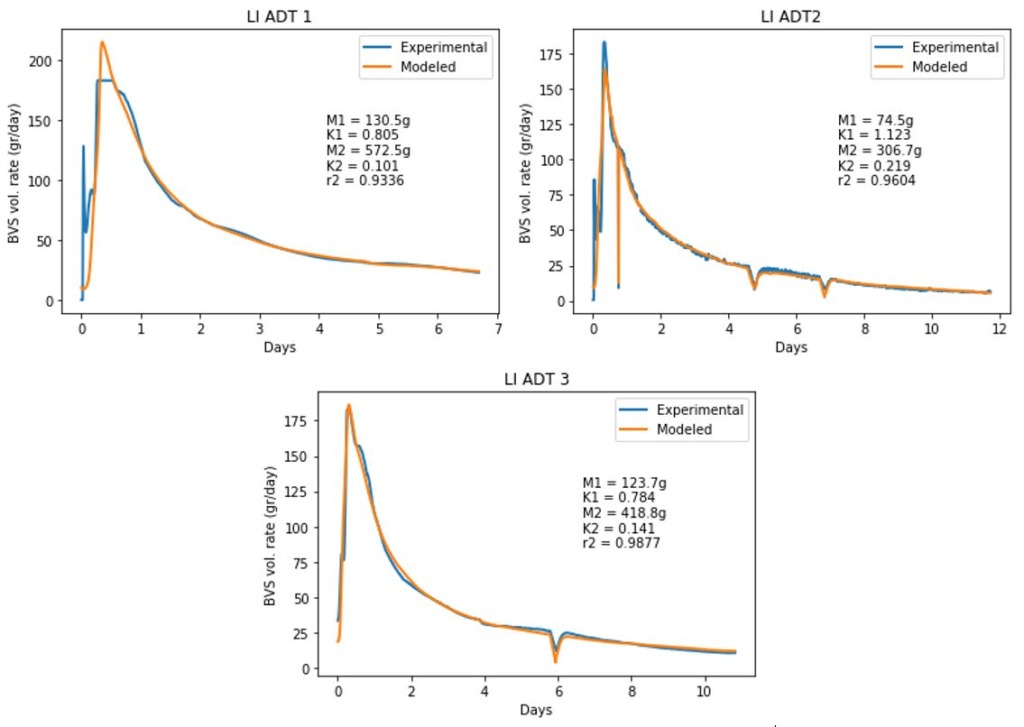
Figure 3 shows a two-component model fit to each of the same trials. These models better estimate the peak volatilization at the beginning and accurately estimate the long term, slowly decaying rate after several days. However, they do not account for variations in temperature. While these trials were run at a constant temperature for most of the time, there was a “warm-up” period at the beginning of each trial and some of the trials had fluctuations in temperature due to equipment issues.
To account for temperature variations, a correction factor can be applied as shown in Eqn 4 and Eqn 5. However, this model does not have a simple, intrinsic solution like the others. Therefore, an explicit time step model must be used instead (Eqn 6). Figure 4 shows the two-component, temperature-corrected model applied to each of the digestate compost trials. Note that the temperature correction factor was normalized to 60C, producing a factor at the scale shown in Figure 1.

These models capture some of the detail of the “warm-up” period at the beginning and model later temperature fluctuations very closely.
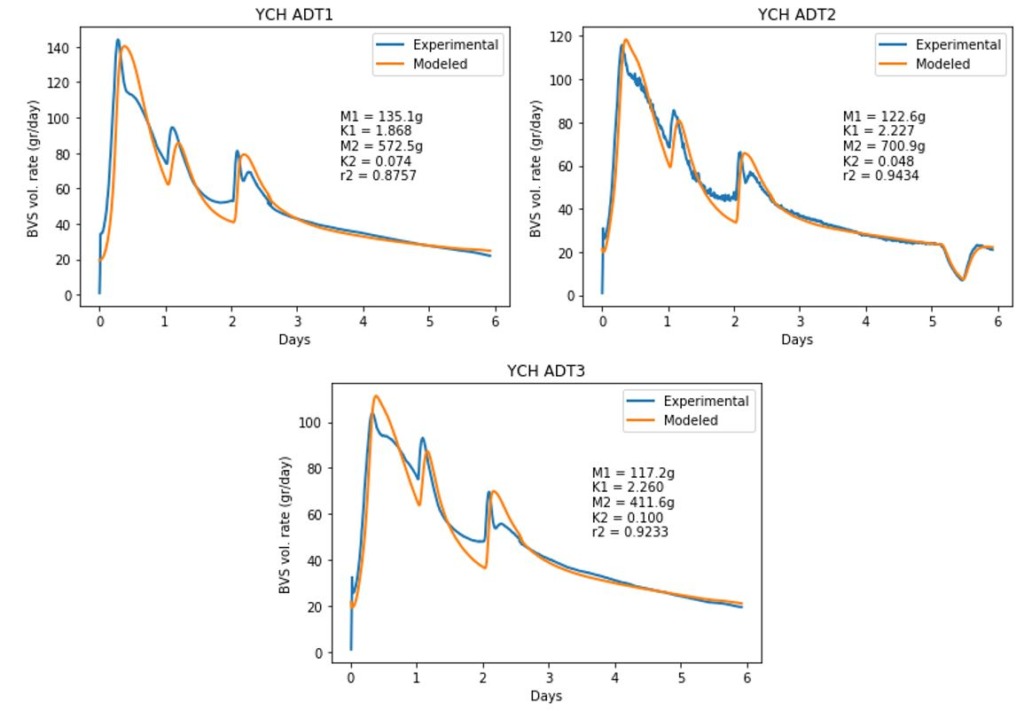
This same model was fit to three additional process lab trials using a mix of agricultural residuals. The temperature was intentionally varied over the trial period, being stepped from 30C, to 40C, and then finally to 60C. Figure 5 shows models fit to each set of data. While the model manages to capture the change in volatilization due to temperature, it consistently overestimates.
The two-component, temperature corrected model appears to be a good representation of trial data produced by the ADT. In most cases, R2 is well above 0.90. However, it tends to overcompensate for temperature shifts and does not fit well to the first hours of the data in many cases. The model also does not have an intrinsic solution and requires time-step evaluation. This is not a major problem since python and excel can both quickly provide solutions.
It appears that microbes bio-oxidize the BVS at different rates. Perhaps further research could help us better understand this, but in the meantime we see that two-step regression modelling can closely approximate how much CO2 will be generated from a compost sample. This can be useful for:
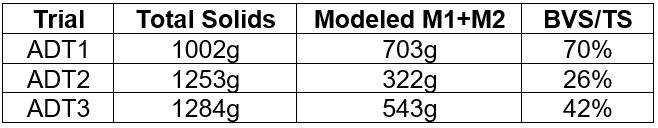
If measurements of the total mass and total solids of each sample are available, the models above can be used to estimate the ratio of bio-available solids to total solids. Model calculations for the digestate data are shown in Table 1. Unfortunately, there is a large amount of scatter in the results.