

Compost sites are unusual among industrial operations in that they both generate and consume water, often at the same time and in several different forms. A facility takes in moisture with its feedstock, releases water as a byproduct of microbial decomposition, collects rainfall across its paved surfaces, and condenses water out of its aeration exhaust — while at the same time needing water to hydrate incoming material and irrigate active piles. Understanding these categories, and how they move through a site, matters for both new facility designs and the day-to-day operation of existing ones.
This article walks through how water is classified at a compost site, how each type can be used, what determines how much water a site consumes, and how Engineered Compost Systems (ECS) models the full water balance — illustrated with a worked example for a 25,000 ton-per-year reversing aerated static pile (ASP) facility in Seattle.
Water at a compost facility falls into a small number of categories, distinguished mainly by whether it has contacted active (pre-pathogen-reduction) material and is therefore potentially pathogenic. The distinction drives where the water can be used and how it must be managed.
Contact water, pathogenic
Contact water, non-pathogenic
Duct condensate
Stormwater
Most compost sites achieve zero net discharge for contact water — that is, contact water is captured and reused on site rather than released to the environment.
Each category of water has a different set of acceptable uses. Matching the right water to the right use avoids odor problems, protects finished product quality, and keeps the site in compliance.
Contact water, pathogenic
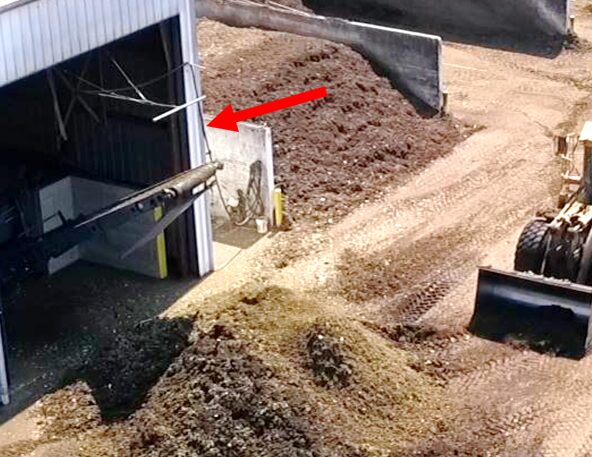
Contact water, non-pathogenic
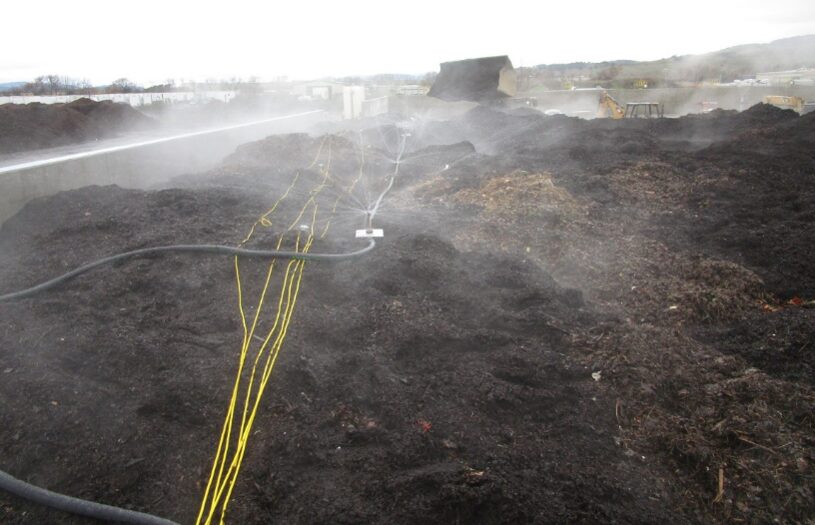
Stormwater
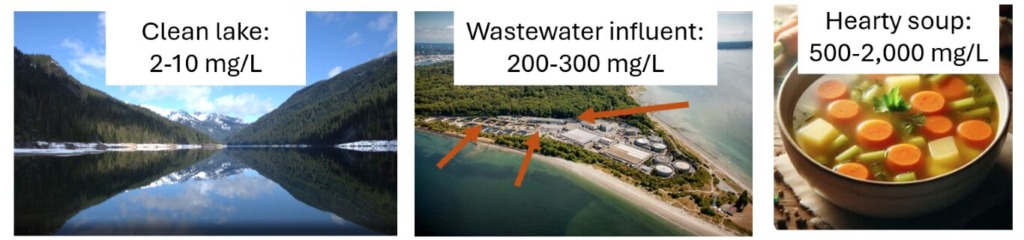
Contact water is biologically and chemically active. Its strength varies with feedstock, season, and how much it has been diluted by rainfall, but it can be high in organic load and nutrients. Typical ranges are shown below; exact composition is site-specific and should be characterized through sampling.
| Category | Description | Typical Concentration |
|---|---|---|
| Organic Matter | Biological and chemical oxygen demand (BOD & COD) | BOD 500–1,500 mg/L (dry weather); BOD 50–200 mg/L (wet weather) |
| Nutrients | Ammonia / nitrogen, phosphorus | Ammonia 100–500 mg/L; phosphorus 2–10 mg/L |
| Salts and metals | Sodium, potassium, calcium, chloride | 500–2,000 mg/L (varies) |
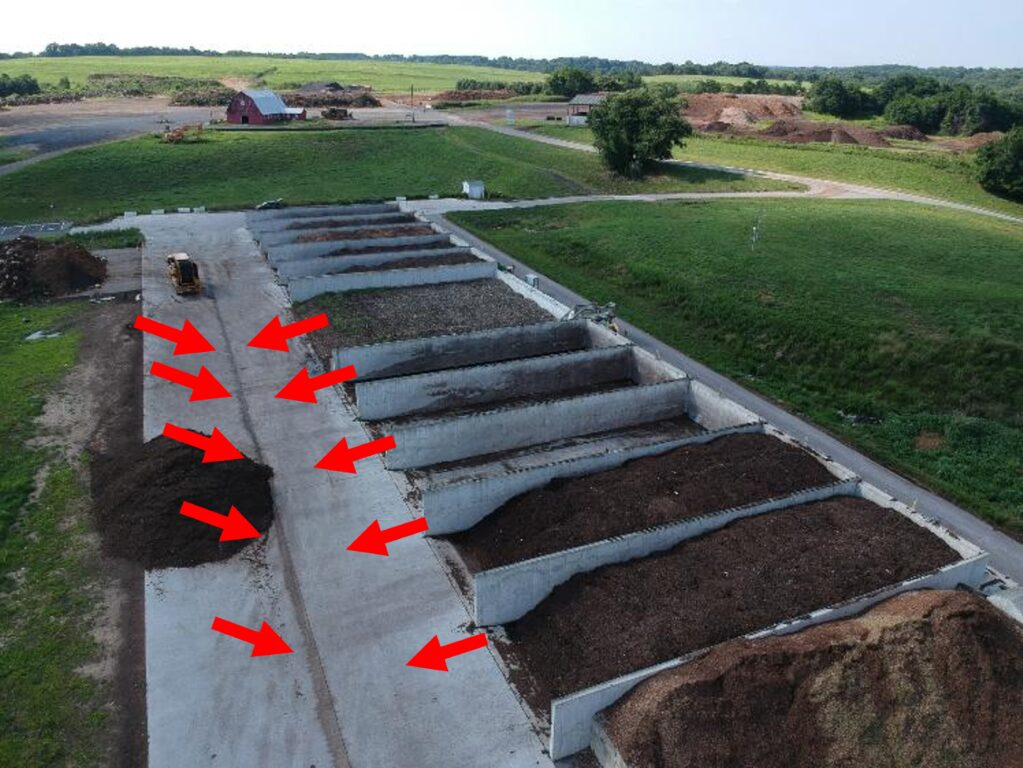
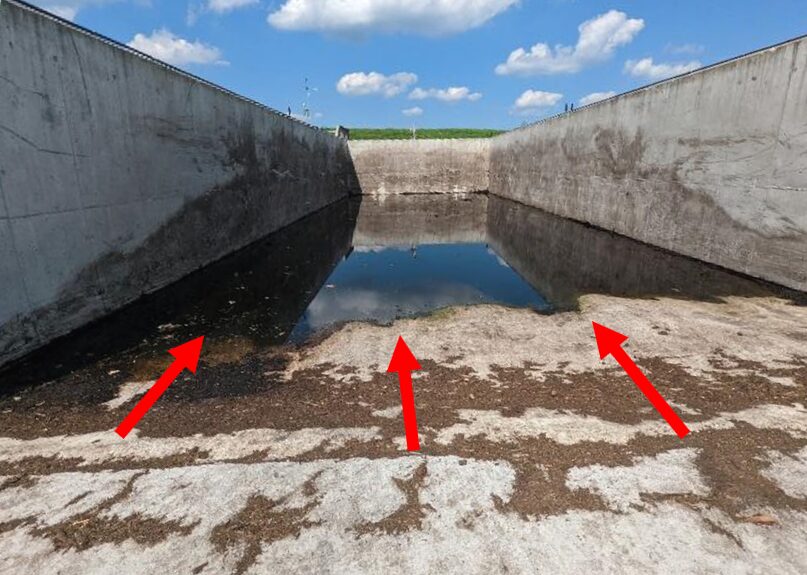
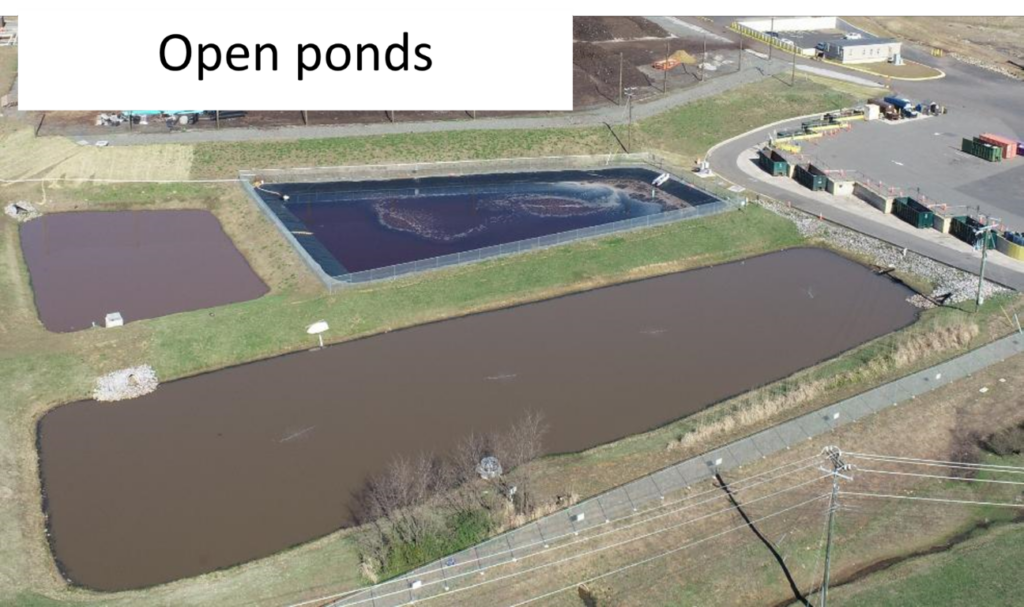
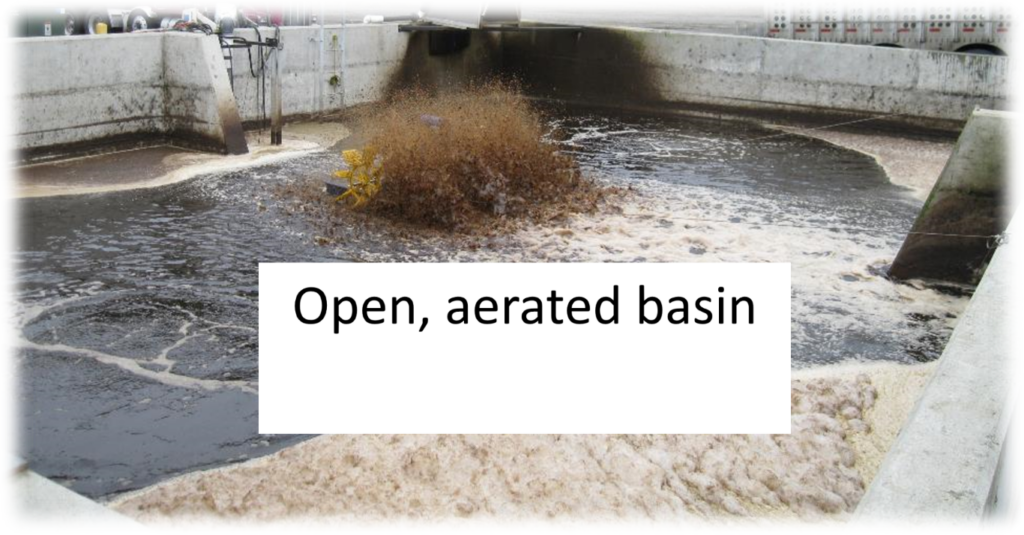
A compost site generates several different types of liquid, and each needs an appropriate drainage path. Getting the drainage system right is vital to avoiding groundwater contamination and excessive odors. Contact water in particular must be kept segregated from clean stormwater so the two are not unnecessarily combined.
How contact water is collected
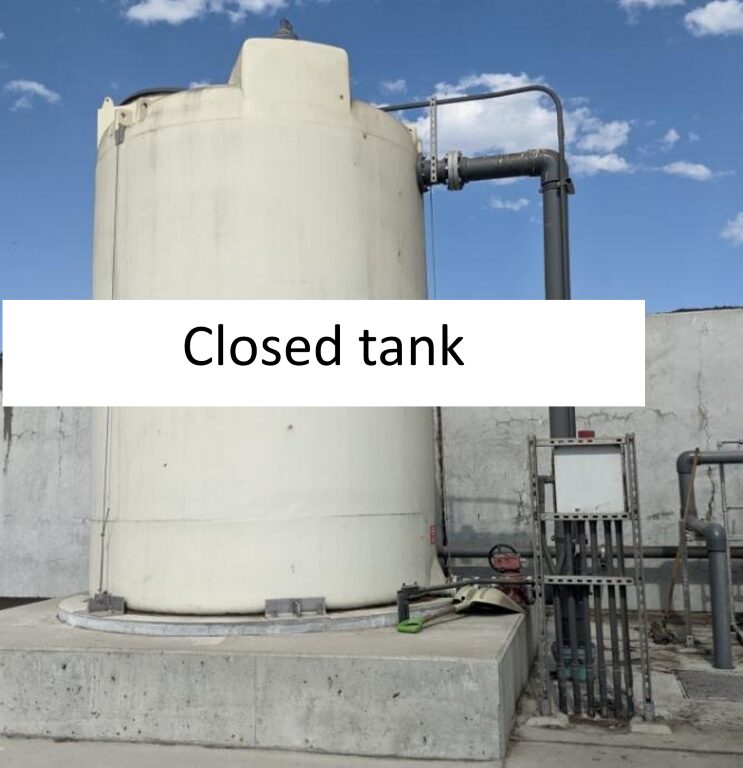
Where water is stored
Water is a vital component at multiple phases of the composting process. Compost microbes need moisture to remain active: below roughly 40% moisture content they lack sufficient water to be effective, and the aerobic process slows. The operator should aim to hydrate and rehydrate the mix as needed to maintain moisture levels in the productive 40-60% range throughout the process. The figure below outlines typical major steps of commercial composting and where water is commonly added:
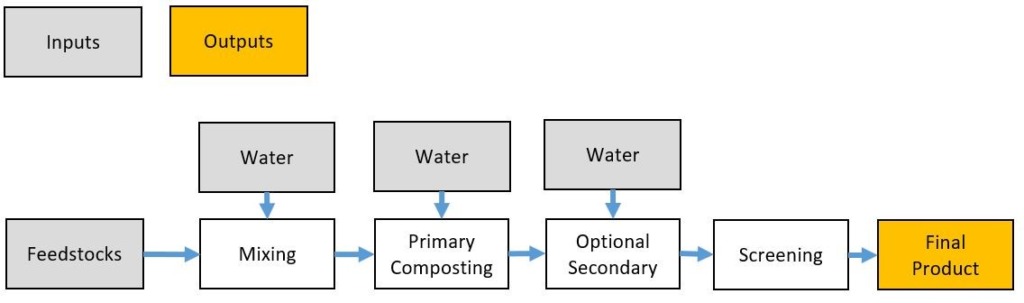
During mixing
Water is added during mixing to hydrate the incoming mix up to Best Management Practice conditions of about 60% moisture. The required volume varies widely by feedstock type, regional climate, and season. Wetter than 60% can rapidly inhibit the pile’s ability to heat up due to relatively less bio-available volatile solids per mass of water, and the thermal load of raising temperature (water has a relatively high specific heat).
Primary composting
The system should apply surface irrigation to help maintain a cool surface temperature, which aids absorption of volatile organic compounds (VOCs) and odors. A moist surface also reduces dust and offers an efficient path for delivering moisture into the pile. Where a process includes more than one phase, the operator should add water before the material is turned or flipped, using surface irrigation infrastructure together with a front-end loader to improve moisture uniformity. Because moisture levels can change substantially from the beginning to the end of each phase, it is important to re-hydrate the mix back toward BMP conditions for efficient composting.
Secondary composting
During secondary composting, the operator should continue surface irrigation as needed. At the end of the process, additional moisture may be added to optimize screening conditions. The operator should monitor the beginning and end of the process to verify moisture levels are optimized throughout.
Moisture decreases over time during aerobic composting as microbes respire and release H20. Once material reaches around 40% moisture the biodegradation rate begins to slow. As mix moisture continues decreasing, the biodegradation rate approaches zero as microbial activity drops. Moisture levels in excess of about 62–65% can also process inhibit the process due to a relatively lower fraction of volatile solids (more solids have been replaced by water) and more energy required to heat water and reach thermophilic temperatures.
Screening
Most compost sites screen the finished material into various size fractions to create saleable products and remove lingering contamination. Moisture content at the time of screening matters: material that is too dry generates excessive dust, while wet material tends to blind the screen and carry oversized particles through. Most screens perform well around 40–45% moisture. Operators can add water upstream of the screen to bring material into that range if needed.
The volume of water consumed by a composting site depends on several factors, including incoming feedstock properties, local weather, and the type of composting process employed.
Feedstock properties
Incoming feedstock should start near 55–60% moisture content to ensure the conditions needed for decomposition. Composting becomes moisture-inhibited around 40% — the aerobic process slows with inadequate moisture — and feedstock moisture tends to decrease over time as the process proceeds.
Weather
Local weather has a direct impact on incoming feedstock conditions. In dry climates, or in applications with long retention times, it is often necessary to add water to maximize the time during which moisture conditions allow rapid composting; surface irrigation also serves dust control. Conversely, in climates with frequent, heavy rainfall, the starting mix moisture may exceed the BMP threshold. In that case we recommend adding a drier amendment — commonly woody biomass — to bring the starting moisture down. When initial moisture exceeds about 62–65%, the compost becomes inhibited and bio-oxidizes very slowly.
Process type and geometry
The composting process type itself often has the greatest impact on water usage, through two main levers: pile geometry and bio-oxidation rate. Covered aerated static pile (CASP) composting minimizes exposed surface area compared with a turned windrow system, which reduces pan-evaporation losses and therefore the additional moisture required.
Bio-oxidation rate also has a large effect. Because water is a byproduct of aerobic composting, faster bio-oxidation releases more moisture. A reversing CASP system, for example, will tend to bio-oxidize material much faster than a turned windrow — so daily evaporation is higher, but so is the volume of water released as bio-available solids decompose. While bio-oxidation rate depends on both process conditions and mix characteristics, selecting a system that enables better process conditions tends to increase it.
Duration matters as well: more stabilization (longer retention) generally requires a greater volume of water. And the application method is not neutral — a static pile is easy to build infrastructure for and to irrigate, but water applied at the surface tends to channelize rather than distribute evenly through the pile.
Key variables affecting water use
Pulling these together, the variables that most influence a site’s process water balance are:
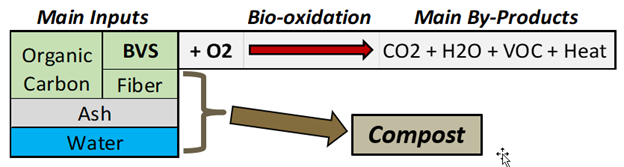
Definitions. BVS = bio-available volatile solids (the readily degradable “goo”). Fiber = cellulose, lignin, and similar slow-to-degrade material. VOC = volatile organic carbon. K-factor = the percentage of remaining bio-available volatile solids degraded per day.
Designing a water management system means balancing water gains and losses across seasonal variation in order to calculate the additional water required (by type and volume), the storage volumes needed, the volume that must be sent off site for treatment, and the cost/benefit of adding a roof. ECS performs this analysis with a water model built from decades of commercial compost-system design.
Worked example: 25,000 TPY reversing ASP, Seattle
The following example models a 25,000 ton-per-year reversing ASP facility in the Seattle climate. The model assumptions and weather inputs are shown first, followed by the resulting annual water balance. Note, this model considers the compost pile only, but does not consider stormwater for other surfaces, or if additional curing is used (both are typical at commercial facilities). This intends to shed light on the key variables that influence water use.
Model assumptions
| Assumption | Value |
|---|---|
| Primary K-factor (% of remaining BVS degraded per day) | 1.5% |
| Bio-available fraction of volatile solids | 40% |
| Average inbound moisture | 55% |
| Target moisture | 56% |
| Average moisture after primary | 49% |
| Re-wet target moisture | 53% |
| Mass remaining after primary | 77% |
Weather assumptions
| Parameter | Value |
|---|---|
| 24-hour, 25-year storm | 4.6 in |
| Annual precipitation | 54.8 in |
| Pan evaporation | 34.4 in |
Annual water balance (normal year)
| Stream | Annual volume (gal) | Notes |
|---|---|---|
| Contact water generated | 141,000 | Peak storage capacity ~20,355 gal |
| Stormwater generated | 917,000 | Peak storage capacity ~16,405 gal |
| — of which duct condensate | 932,000* | Largest single source; split between contact and stormwater |
| Total consumption | 698,000 | Mix moisturization, surface irrigation, post-process re-wet, biofilter |
| Net water generation (generation − consumption) | 359,000 | Surplus to be stored, reused, or sent off site |
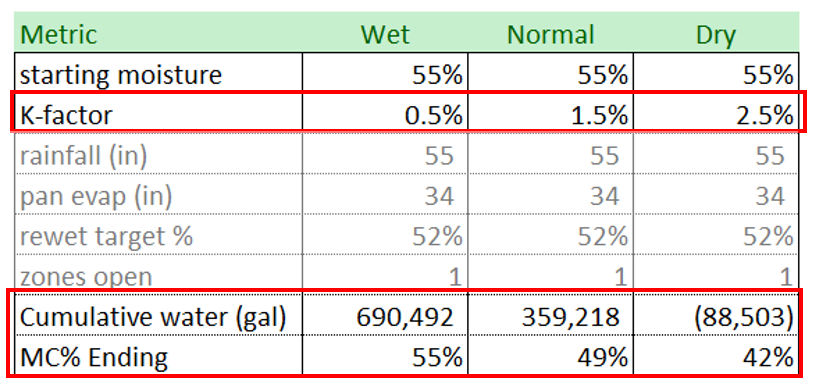
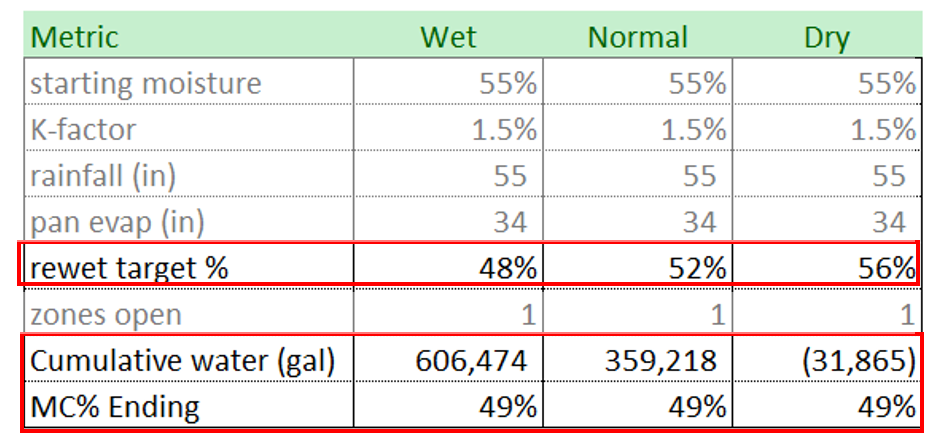
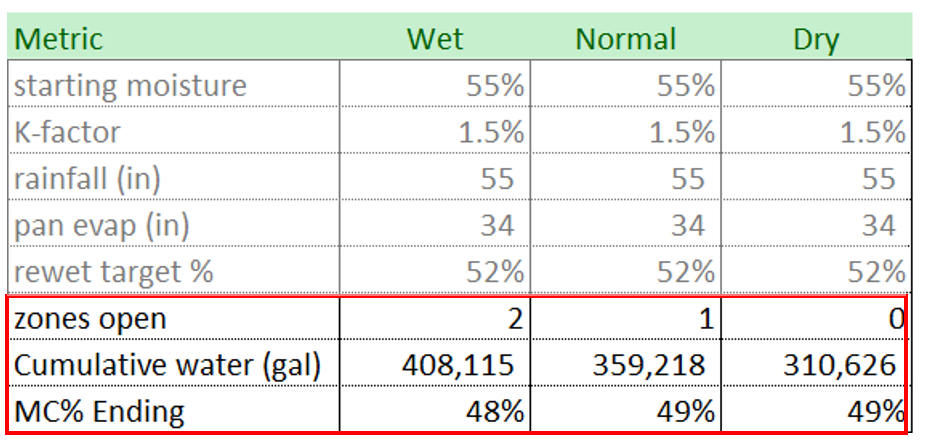
Using the same 25,000 TPY Seattle facility as a baseline (net water of about 359,000 gallons and ending moisture near 49%), the model can be run while varying one factor at a time across a wet, normal, and dry case. This shows which levers move the water balance most.
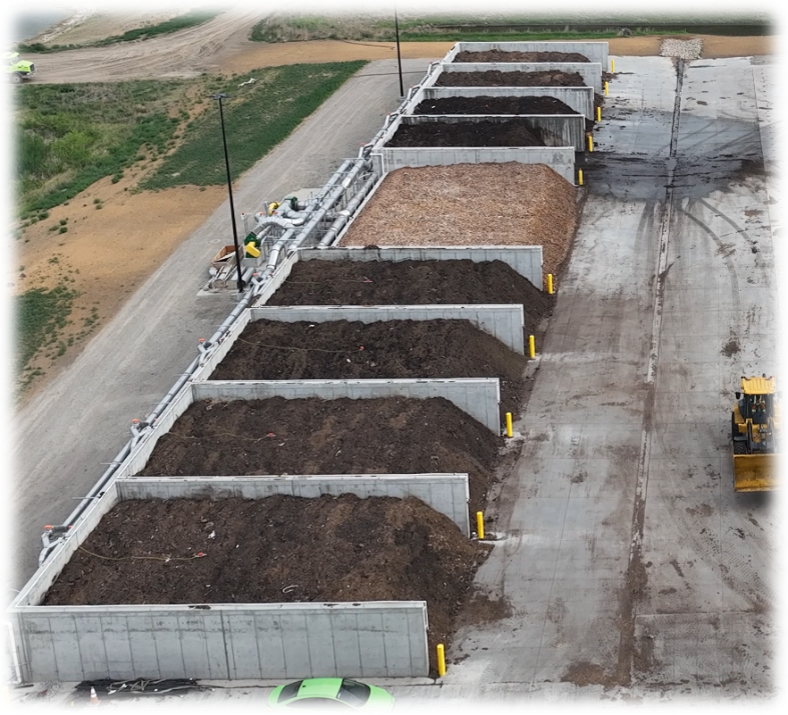
The following slides show the different variables used for comparative analysis.


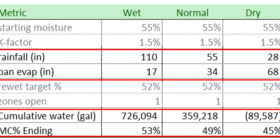
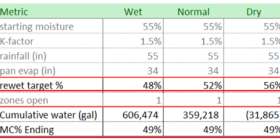
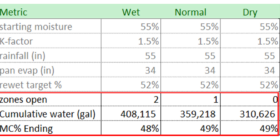
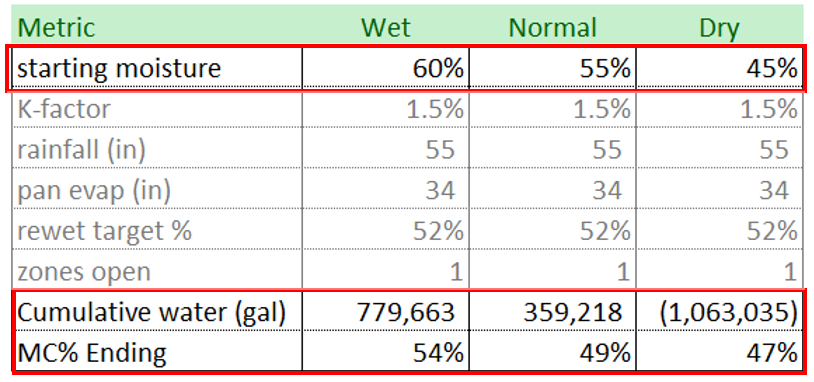
These values are summarized below, with the resulting net water and ending moisture content:
| Variable | Range tested (wet / normal / dry) | Net water, gal (wet / normal / dry) | Ending MC (wet / normal / dry) |
|---|---|---|---|
| Starting moisture | 60% / 55% / 45% | 779,663 / 359,218 / (1,063,035) | 54% / 49% / 47% |
| K-factor | 0.5% / 1.5% / 2.5% | 690,492 / 359,218 / (88,503) | 55% / 49% / 42% |
| Meteorological (rain _ pan evap, in) | 110 _·17 / 55 _·34 / 28·_ 68 | 726,094 / 359,218 / (89,587) | 53% / 49% / 45% |
| Re-wet target | 48% / 52% / 56% | 606,474 / 359,218 / (31,865) | 49% / 49% / 49% |
| Empty (open) zones | 2 / 1 / 0 | 408,115 / 359,218 / 310,626 | 48% / 49% / 49% |
The charts below provide a visual summary of this data. Observations:
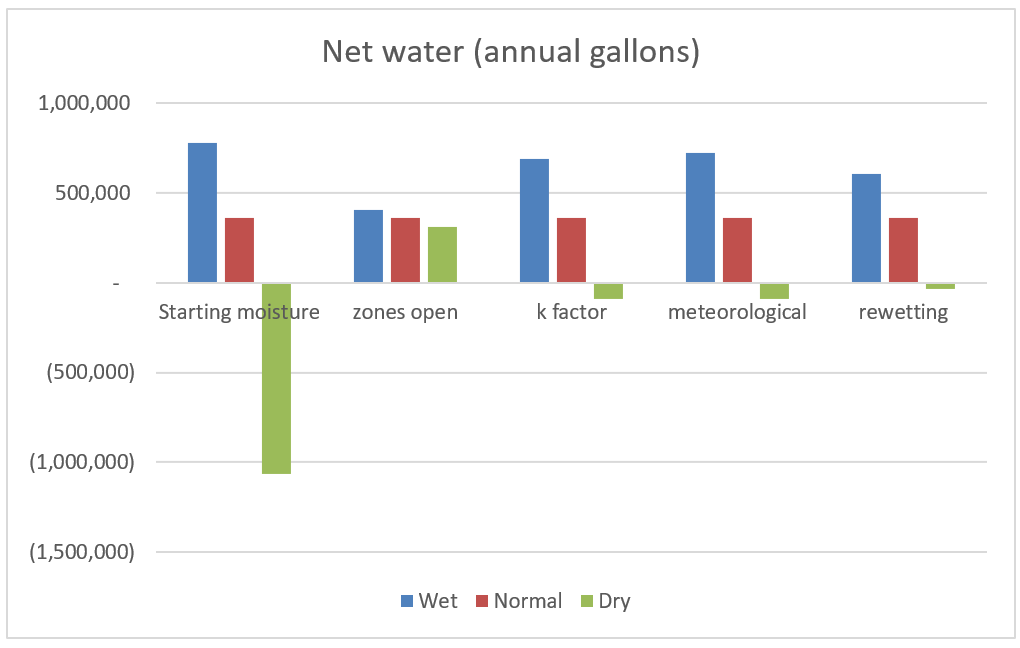
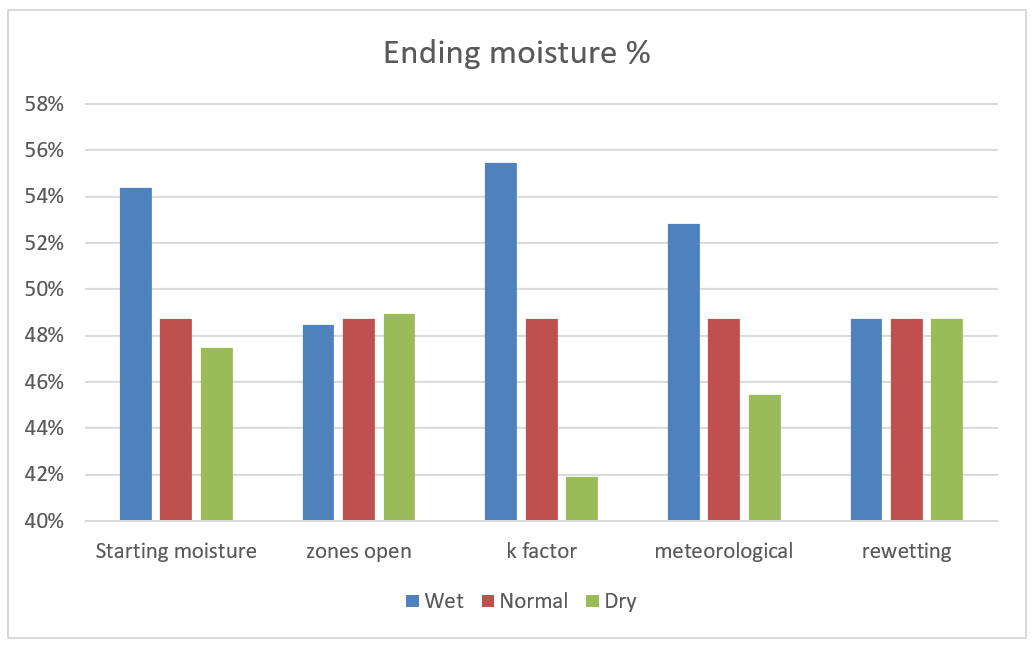
The practical takeaway is that a water management system should be sized for the range of conditions, not just the average. A facility that is comfortably in surplus in a normal year may need imported water in a dry year, and storage that is adequate in a dry year may overflow in a wet one — which is exactly what the seasonal model is built to quantify.
For a super high-level rule of thumb, many sites may consume 10-30% of their inbound feedstock mass as water (for 25k tons/yr of compost, allow 2.5-7.5k tons of water). However, for an accurate picture of how much water your municipal compost facility will consume, you will need the following information:
Based on decades of commercial compost-system design for sites all over the world, ECS has developed a water model for calculating consumption requirements, and can help devise a composting solution that minimizes odor, cost, and the volume of water needed. Lean on ECS’s water modeling service to support planning for your new composting site today.