Bench-Scale research conducted by ECS to evaluate biochar’s potential as an additive in composting curbside-collected food waste and yard trimmings. By Tim O’Neill and Liv Johansson. An abbreviated version of this report was published by Biocycle on March 12th, 2025.
Recent years have witnessed growing interest in biochar’s potential role in organic recycling, partly fueled by claims about its benefits when co-composted with raw feedstocks. Researchers and biochar producers frequently cite advantages including accelerated stabilization, reduced volatile organic compound (VOC) and odor emissions, enhanced nitrogen retention, improved pH regulation, and lower aeration requirements. However, a critical examination of the scientific literature reveals a significant limitation: most research has been conducted on high-nitrogen, carbon-deficient mixtures (primarily manure) using passively aerated processes like windrows.
This presents a disconnect with current North American composting trends, which increasingly focus on food waste and yard waste mixtures processed using forced aeration systems. To address this research gap, Engineered Compost Systems (ECS) conducted bench-scale trials to evaluate biochar’s purported benefits specifically in well-aerated, temperature-controlled processes using typical carbon-rich green waste and food waste mixtures.
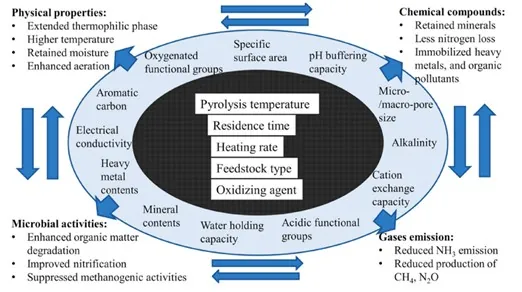
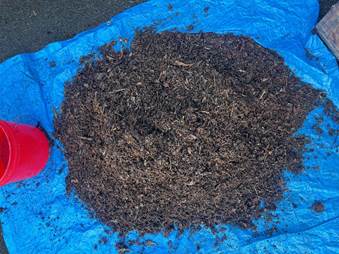
Biochar is a stable, charcoal-like substance produced through pyrolysis or gasification of biomass. It possesses numerous properties that make it valuable for agricultural, environmental and industrial applications, including improving soil organic matter, stormwater biofiltration, soil remediation, and carbon sequestration. Its chemical and physical characteristics vary widely depending on feedstock selection and processing techniques. Key production parameters such as pyrolysis temperature, residence time, and heating rate significantly influence resulting biochar properties including surface area, micro-porosity, cation exchange capacity, and alkalinity. These variations in turn affect biochar’s functional performance in composting applications.
Figure 1, below, illustrates how production conditions (center ring) influence the resulting biochar qualities (intermediate ring) and their potential impact on composting. For example, higher pyrolysis temperatures paired with rapid kiln heating increase biochar surface area by creating more micropores. This enhanced microporosity improves the material’s adsorptive capacity.
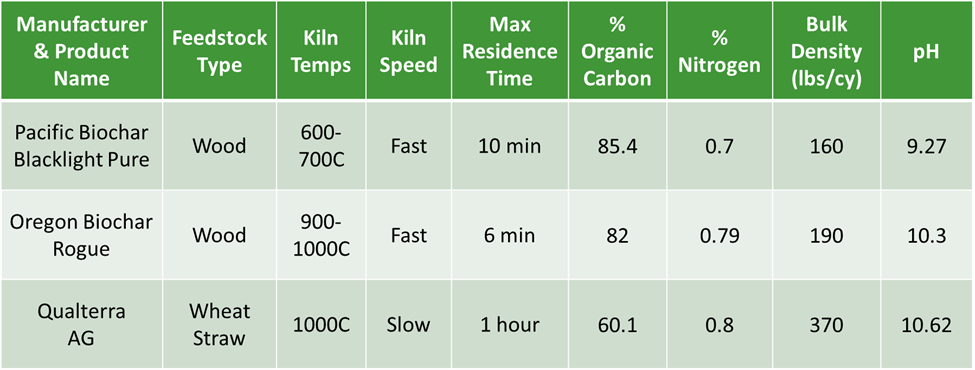
In our research, we evaluated three commercially available biochars—Pacific Biochar’s Blacklight Pure, Oregon Biochar’s Rogue, and Qualterra’s Ag Biochar—examining how their production parameters (feedstock type, kiln temperature, residence time) and physical properties affected co-composting results.
Our testing was conducted in three distinct trial sets:
Throughout all trials, we combined biochars with standardized Pacific Northwest green waste and food waste (GW/FW) blends from local commercial facilities. These feedstocks featured optimal bulk densities (750-850 lbs/cy), relatively low pH (5-6), and high carbon content from seasonal leaf debris. For Trials 1 and 2, our laboratory equipment replicated conditions found in well-maintained capped, aerated static piles (CASPs). This included maintaining oxygen levels above 15%, ensuring uniform aeration throughout the composting mass, neutralizing low pH through controlled early mesophilic phases, and moderating peak temperatures for optimal microbial activity.
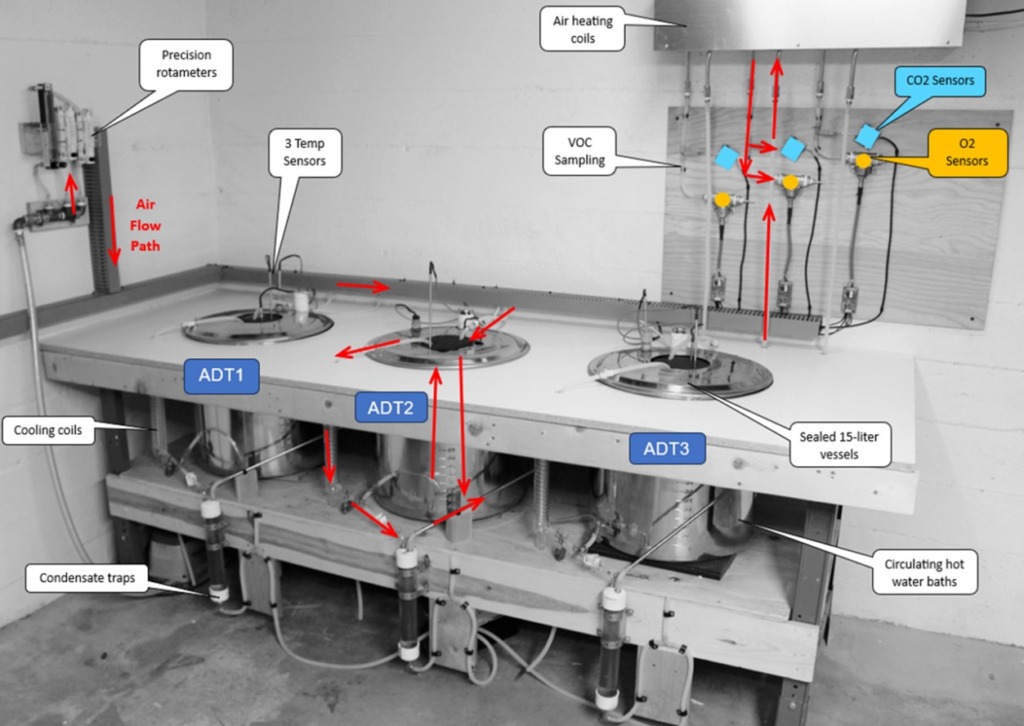
ECS’s Compost Process Lab is equipped with three instrumented Aeration Demand Testers (ADTs) that provide controlled compost process conditions and measure the real-time levels of CO2 and O2 (the primary indicators of composting activity).
Each ADT is a 15-liter sealed stainless-steel vessel nested within another steel vessel that serves as a stirred, temperature-controlled water bath. Sensors monitor the temperature in the headspace (T1), compost sample (T2), and in the water bath (T3), as illustrated Figure 3. All sensor data is logged every ten minutes. ADTs maintain water-bath temperature to within +1°C and airflow to within 2% of full-scale, allowing process conditions to be closely monitored and controlled. This control allows ECS researchers to determine the impacts of other inputs or conditions much more effectively than in field trials, where environmental and input conditions vary widely.
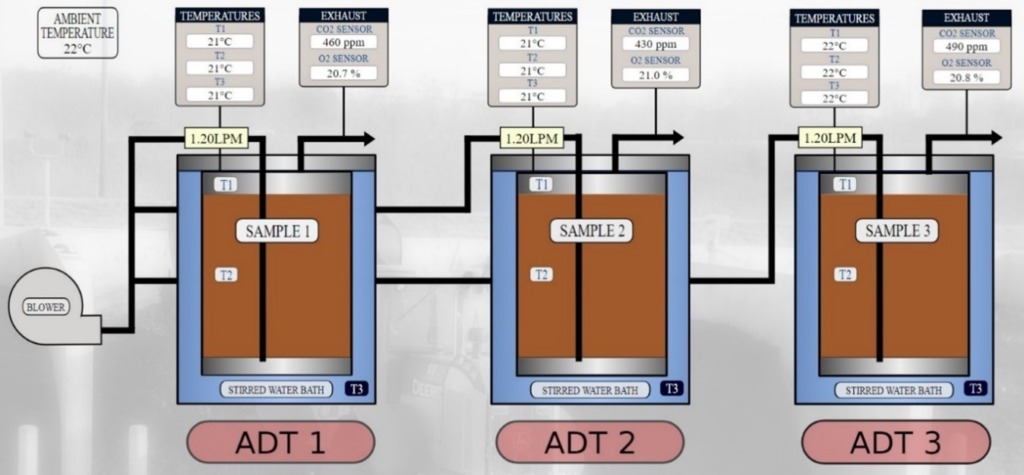
CO2 and oxygen levels are continuously monitored by sensors attached to the exhaust air outlets. Precision rotameters allow airflow to be controlled, and gas flux rates determined.
Proponents of biochar addition to compost suggest it accelerates stabilization through multiple mechanisms: improved airflow, enhanced microbial habitat, better moisture retention, and extension of the thermophilic composting phase.
To differentiate between true stabilization acceleration and simple dilution of putrescible materials with already-stable carbon, we employed dual measurement approaches: continuous CO2 flux monitoring and Solvita stability testing, which revealed how process conditions (oxygen levels, temperature, moisture, pH) and feedstocks influenced microbial bio-oxidation rates.
Moisture contents were quantified through standardized oven-drying tests, with samples collected at both the beginning and conclusion of ADT processing cycles. Comprehensive end-product quality assessment was conducted by Soil Control Labs (Watsonville, CA). Their analytical suite evaluated whether biochar incorporation improved nitrogen retention, organic carbon content, and overall agricultural suitability of the finished compost products.
All Trial 1 and Trial 2 test mixes were prepared using the following steps:


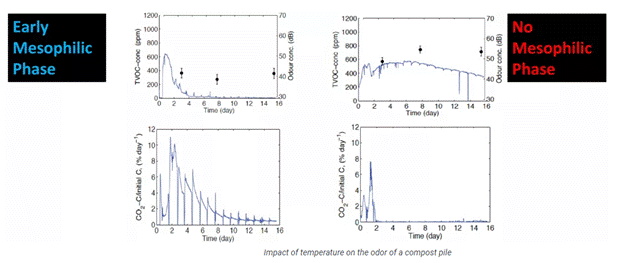
Most GW/FW mixes arrive at composting facilities with pH below 6—acidic enough to inhibit microbial activity and increase VOC emissions. Research by Dr. Celia Sundberg has demonstrated that maintaining mesophilic temperatures (ideally <45°C) for the first two days of active composting allows mesophilic microbes to consume organic acids, neutralizing pH and facilitating rapid composting while minimizing odor and VOC emissions. ECS has replicated these findings in field and laboratory research (Figure 8).
To isolate biochar’s impact on stabilization rates independent of pH effects, we started all Trial 1 and Trial 2 tests with a brief (12-36 hours) mesophilic phase to ensure pH inhibition would not affect the performance of the control batches.


Microbes stabilize compost feedstocks by consuming bio-available portions of volatile solids (BVS), releasing CO2 and heat as by-products. CO2 production is the primary metric for showing progressive stabilization, and this microbial bio-oxidation is also the mechanism by which volatile solids (VS) are reduced. Biochar does not provide biodegradable carbon but does contribute combustible carbon (i.e., VS).
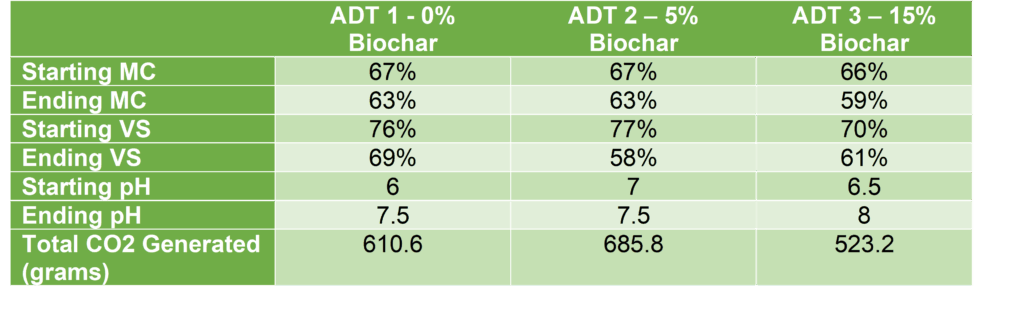
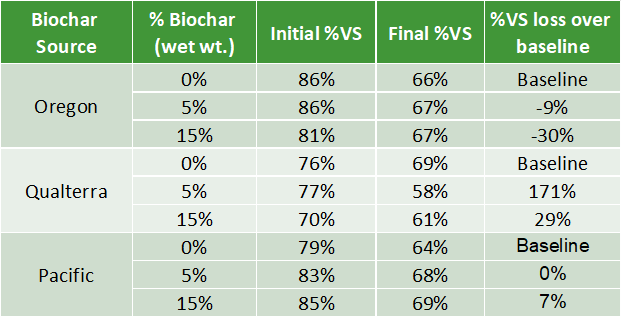
We measured the VS of the initial mixes on day 1 and at the end of the trials on day 14 using a combustion oven. Table 5 provides the VS destruction in the biochar amended mixes as a percentage of the VS destruction in the baseline mix. These results suggest that different biochars provide very different effects on stabilization rates. The Oregon biochar appears to have a negative effect on VS destruction. The Qualterra biochar test results, although the data is inconsistent, significantly enhanced VS destruction. The Pacific biochar, unlike the others, appears to have increased the initial VS and slightly over the baseline, and to have moderately increased the VS destruction during composting.
Across all ADT (Aerated Dynamic Testing) trials, increasing biochar percentages showed no measurable impact on composting mass temperature. While the small-scale ADT vessels limit extrapolation to industrial-scale operations, it’s worth noting that vessels with higher biochar content experienced less total bio-oxidation. This suggests that larger piles with equivalent mass and aeration parameters might experience reduced endothermic heating from microbial activity.
Our oven-drying analyses indicated minimal impact of biochar on moisture retention during active composting. In all Trial 1 tests, vessels containing 15% biochar failed to outperform the controls over the 14-day period. The 5% biochar treatments slightly outperformed both control and 15% treatments, but only by negligible margins (1-2% over 14 days)
Regarding nitrogen conservation, our findings did not align with biochar’s purported benefits. Previous supportive studies typically evaluated biochar combined with nitrogen-rich feedstocks (manure, biosolids) in poorly aerated systems. In such conditions, biochar’s lightweight properties might improve bulk density, enhancing process conditions, and therefore nitrogen mineralization.
However, our trials demonstrated that biochar did not increase nitrogen retention in any of our mix ratios. In fact, biochar addition actually appears to have decreased nitrogen concentrations in the finished samples while showing minimal-to-moderate effects on organic carbon compared to controls.
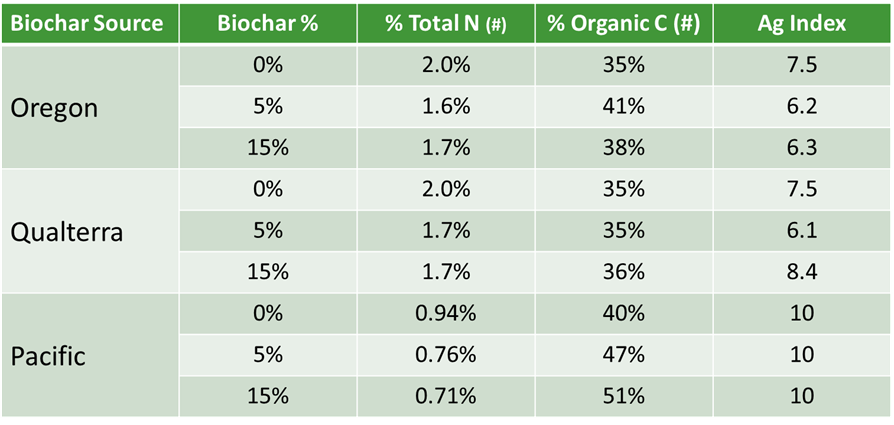
The total nitrogen reduction in our finished samples is an unsurprising consequence of amending with a low-nitrogen biochar (all three of our biochars had less that 0.75% nitrogen by dry weight). As noted by de Oliveira Paiva et al., the pyrolysis process typically burns off large portions (65-90%) of the nitrogen inherent to biochar feedstocks, leaving most biochars to be relatively low-nitrogen amendments. In a well-aerated operation composting moderate-to-high C:N ratio feedstocks, biochar’s process improvements appear insufficient to overcome its dilution effect on nitrogen content.
Composting facilities in regions with stringent air regulations can benefit from methods that reduce the emissions of volatile organic compounds (VOCs). In Trial 2, our goal was to measure the VOC reducing effects of biochar as an admixture. In Trial 2a, we evaluated how concentrations of Oregon biochar affected VOC detection, and in Trial 2b, we considered the impact of biochar particle size on VOC emissions, hypothesizing that smaller particles would have more VOC-abating surface area.
In these tests, we employed a mini photoionization flame detector (PID) to measure total VOC flux, expressed as methane equivalents in our results.

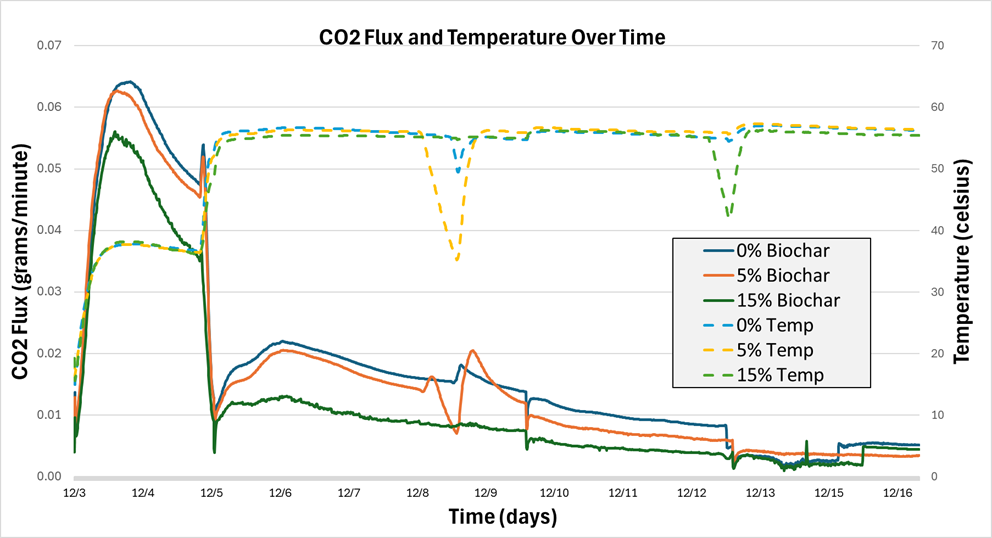
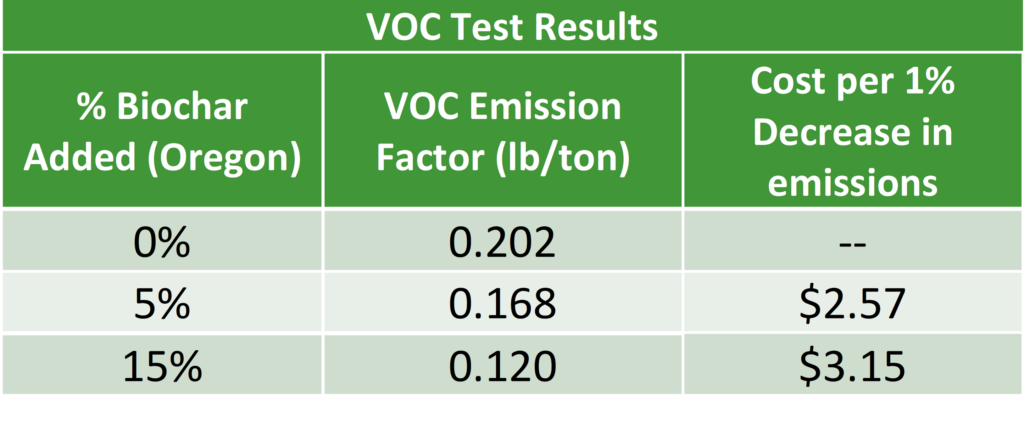
In Trial 2a, we measured VOC emissions from ADTs composting GW/FW mix with the addition of 0% (baseline), 5%, and 15% Oregon biochar on a wet-weight basis. Temperatures and aeration rates were identical in all three ADTs. Mesophilic temperatures of 45C were maintained for about 20 hours before increasing to 60C. The two figures below illustrate the temporal changes in temperature, bio-oxidation rates, and VOC concentrations throughout the 6-day experimental period.
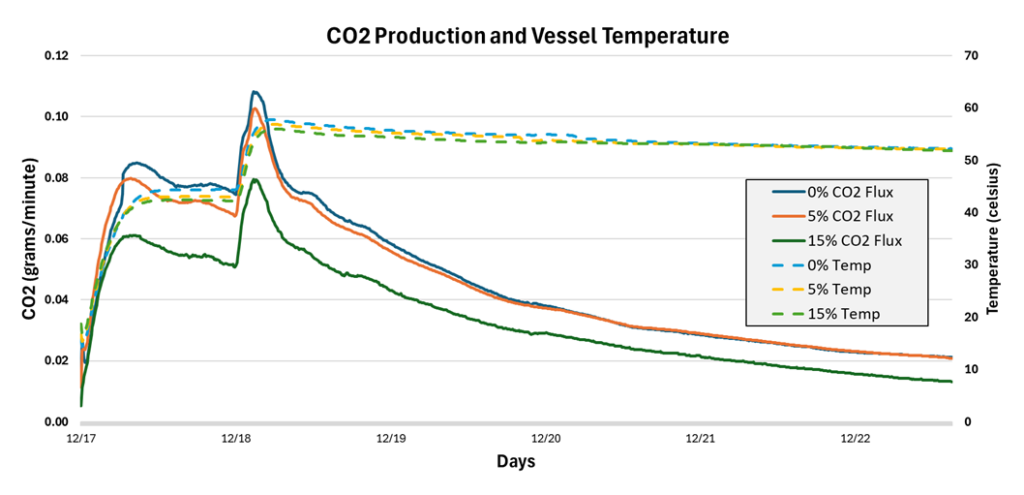
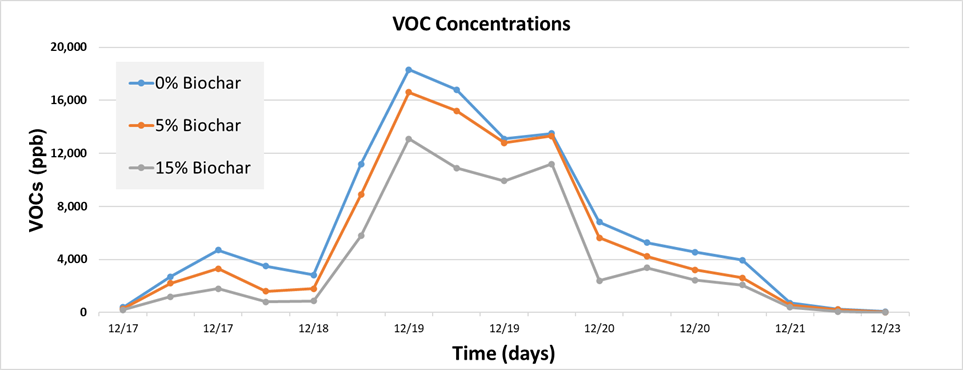
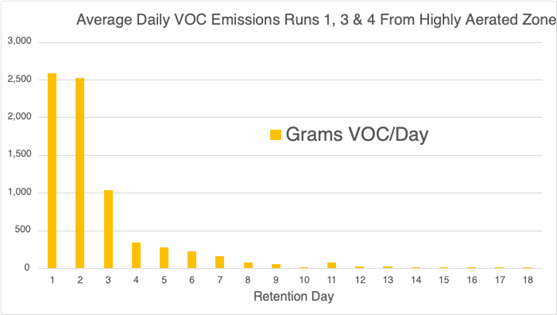
A standard pattern of CO₂ flux was observed, with emissions peaking after temperatures rose from 45°C to 60°C. VOC emissions remained relatively low during the early mesophilic phase but increased to peak roughly simultaneously with CO₂ concentrations. VOC emissions fell to zero ppb within five days in all ADTs. The observation that VOC emissions peaked and tapered to undetectable levels by day 5 is noteworthy, but not novel. Dr. Tom Jobson of Washington State University has documented the same trend in his research. In Dr. Jobson’s research using negatively aerated CASPS, he has consistently seen that 90% or more of total VOCs are emitted from a pile comprised of GW/FW feedstocks within 5 days (Figure 16).
The Oregon Biochar appears to have a meaningful impact on total VOC emissions. Adjusted for dry weight, adding 5% biochar to the GW/FW mix reduced emissions by 15.9%, while 15% biochar reduced emissions by 35.6% (Table 7).

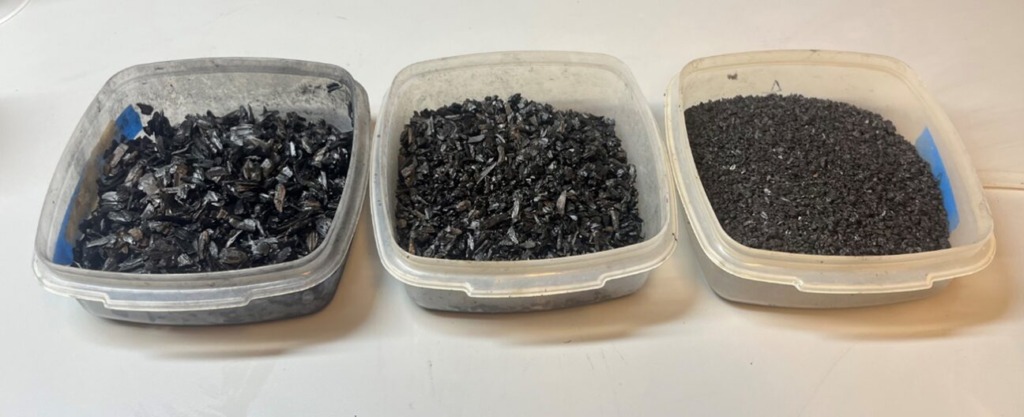
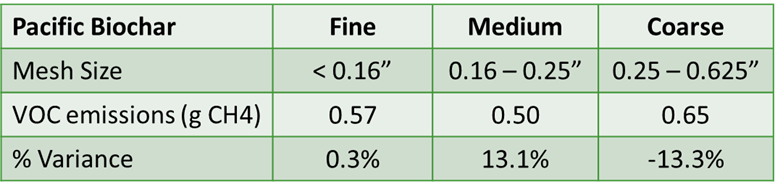
Trial 2b examined the impact of biochar particle size on VOC emissions. Pacific Biochar was crushed and sieved into three sizes: Fine (<0.16″), Medium (0.16-0.25″), and Coarse (0.25-0.625″), and mixed with the GW/FW blend at 2.5% wet-weight basis.
The feedstock mixes were heated to 45C for 16 hours before increasing the water bath temperatures to 60C for the duration of the test.
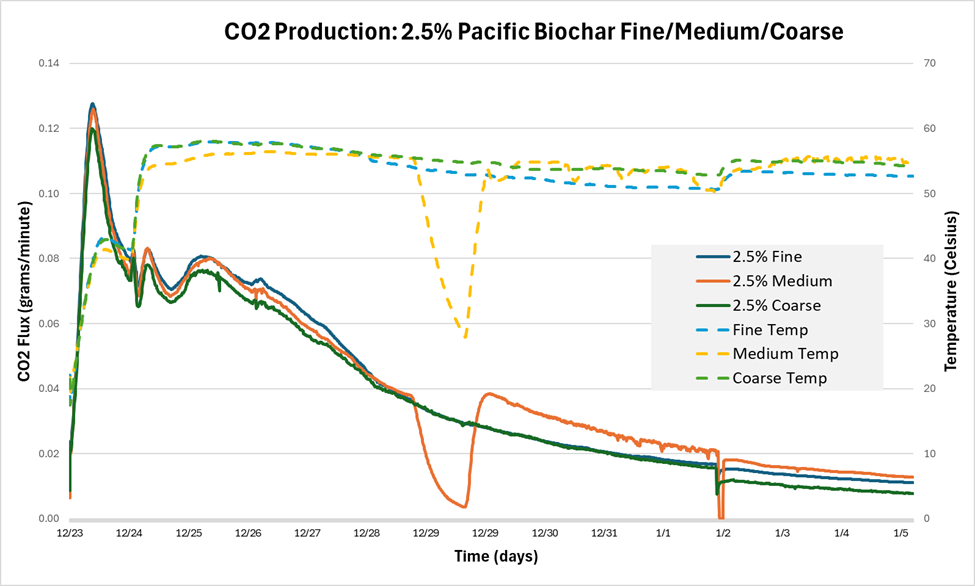
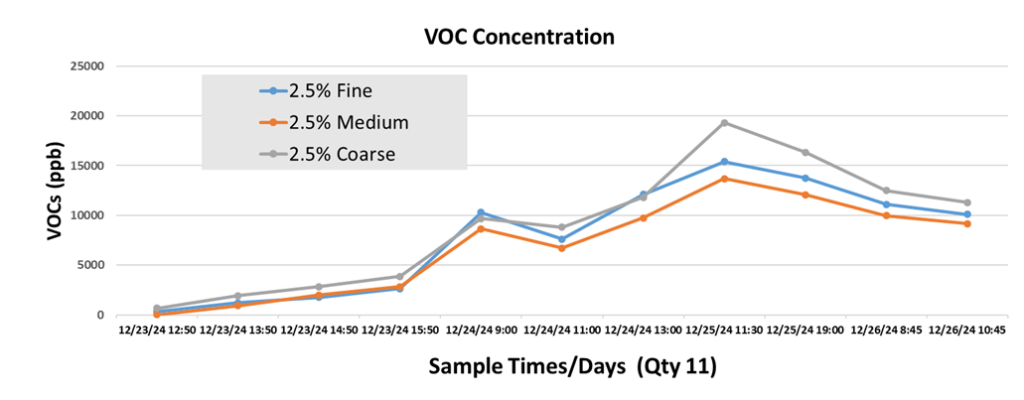
Overall, VOC emissions from all three biochar/feedstock mixes were similar, with the Medium biochar performing the best at minimizing VOCs. This finding contradicted our hypothesis that the Fine biochar would have the most significant effect on VOC reduction attributable to greater relative surface area. Instead, it appears that the manufacturing conditions, namely pyrolysis temperature & residence time that determine the formation of micro-pores have a much more significant effect than gross particle size.
After testing the longer-term impacts of biochar on the composting process in Trial 1, we evaluated the immediate impacts of biochar on raw feedstocks in Trial 3.
To assess the water holding capacity (WHC) of our mixes, we combined our GW/FW mix with 0%, 5% and 15% biochar (by wet weight) into 100-gram samples. These samples were soaked in 200 mL of water for 30 minutes, drained through paper filters for 60 minutes, and separated into three sample cups each. Standard oven-drying tests confirmed the moisture content of samples in each cup.
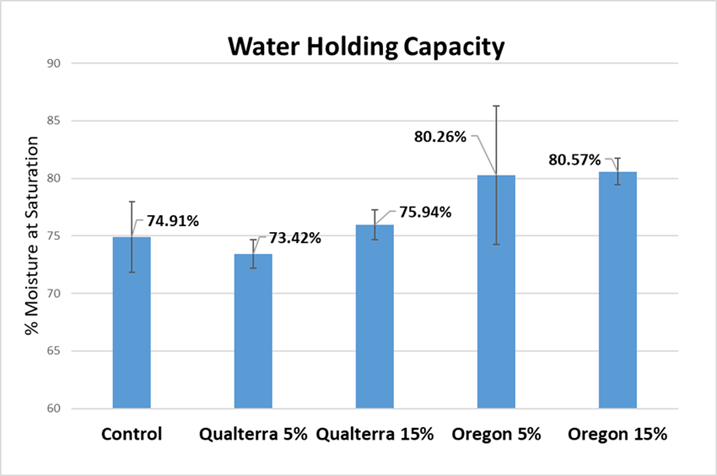
When compared to the control (raw GW/FW), Qualterra AG biochar had a similar water-holding performance, while Oregon Rogue Biochar retained about 5% more water than the control. The results for Qualterra AG were somewhat unexpected given its finer particle size, but research on the impact of particle size on biochar’s WHC indicates that “biochar hydrophobicity increases as particle size decreases, leading to a reduction in water retention capacity,” (Edeh et al., 2021). The Qualterra product had the smallest particle size, potentially explaining these results.
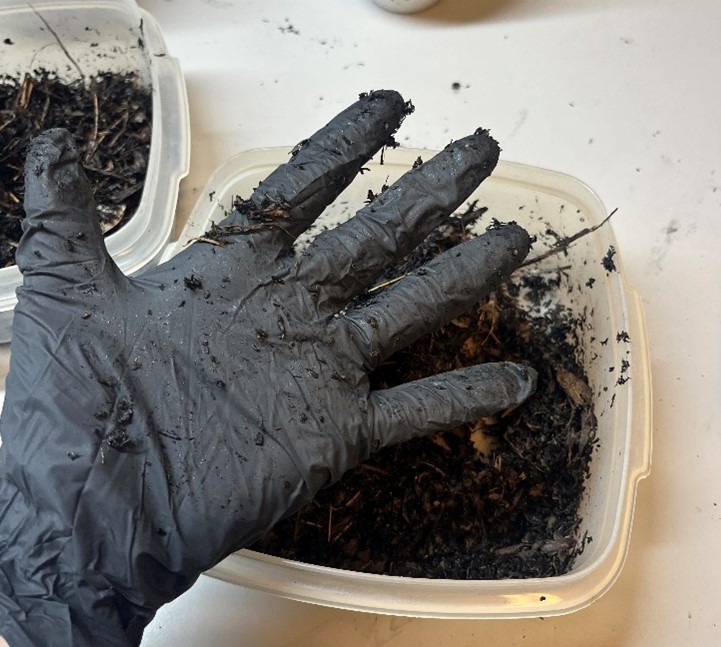
After oven-drying the mixes to complete our WHC tests, we rehydrated them to 60% moisture and performed hand-squeeze tests. These tests are the most accessible method for composters to assess moisture levels in the field, and we wanted to determine whether the addition of biochar would affect the accuracy of this method.
At 60% moisture, both the control sample and the Qualterra AG sample with 5% biochar exhibited typical behavior in hand-squeeze tests: material held together well, left an even sheen on the glove, and released a few drops of free water.

However, the Qualterra sample with 15% biochar, and both Oregon Biochar Rogue samples appeared much drier than 60%. The Oregon 15% sample had no clumping at all and left no liquid sheen, feeling like material closer to 40% moisture. The addition of significant amounts of biochar therefore might limit the accuracy of the hand-squeeze test in the field.
To test biochar’s purported alkalizing effect, we took a gallon of GW/FW mix and “spiked” it with lemon juice to achieve a pH 4.75. Using a digital pH meter, we gradually added biochar to the mix until a neutral pH was achieved. Figure 22, below, illustrates the alkalizing impact of our two biochar treatments.
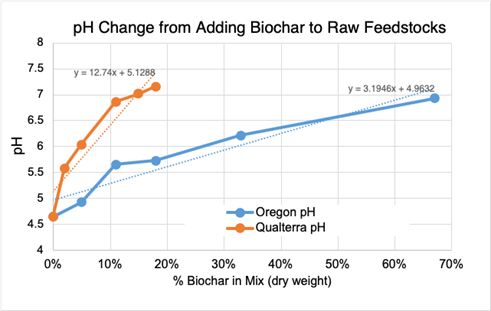
Achieving a pH of 7 required 13% Qualterra biochar (dry mass basis) compared to 67% Oregon biochar.
This performance difference likely stems from several factors: Qualterra AG biochar was more alkaline (pH 10.62 vs. 9.27), had finer texture providing greater surface area for ion exchange, and contained 30.8% ash—over three times Oregon biochar’s 9.3% ash content. Since biochar’s alkalizing effect is generally attributed to ash content, this difference is important to note for composters who desire to increase pH through amending with biochar (Singh et. Al., 2017).
For a high-level economic analysis, the various process improvements tested were ratioed with a generic cost of adding biochar (purchase, delivery and material handling) of $850/ton. This cost was roughly the average in the range of quotations we received.
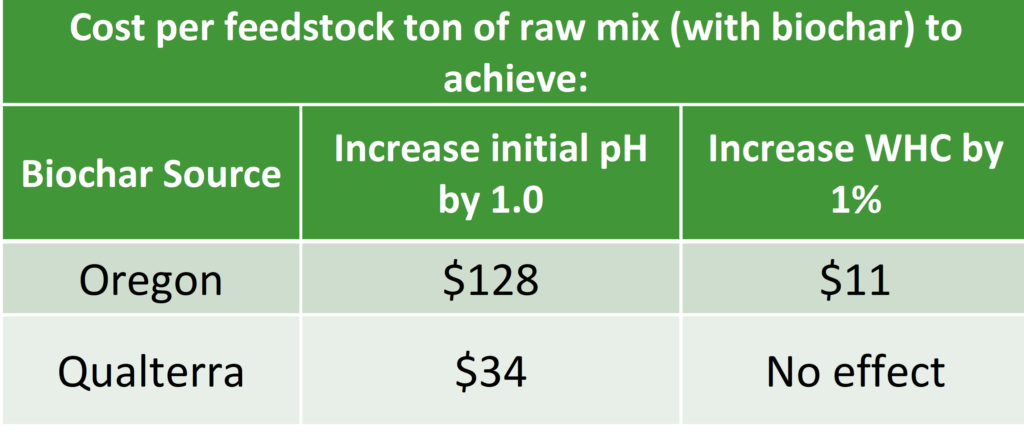
Under our test conditions, we found that biochars manufactured under different conditions provided different composting process benefits. For example, the Qualterra AG product, a finer and more ash-heavy biochar appeared better at increasing the feedstock mix’s pH but not its water holding capacity. The Oregon biochar, on the other hand, did improve the feedstock mix’s water holding capacity but also appeared to dilute total nitrogen in the finished compost sample. And the Pacific biochar seemed to enhance the organic carbon concentrations and AG indices in its samples, while leaving rates of stabilization relatively unaffected.
Our results indicate that co-composting carbon rich feedstocks with biochar in a well-aerated process does not provide the impressive level of benefits reported in the literature for high nitrogen residuals composted with passive aeration. When considering co-composting with biochar, facility operators should assess the characteristics of their starting mix and the properties of the biochars available to them. We then recommend running trials to measure the process effects at various dosing levels. With this data, operators can weigh the costs of procuring and incorporating biochar against their specific operational goals and regulatory requirements to determine if using biochar makes economic sense for their composting process.
Alatas, Mohd Fadhli, et al. “Characterization and Bioconversion of Microalgae Biomass from Wastewater Into Value-Added Products.” Waste and Biomass Valorization, vol. 14, no. 9, 2023, pp. 2897-2919. Springer, doi:10.1007/s12649-023-02415-x.
Antonangelo, J., et al. “The Roles of Co-Composted Biochar (COMBI) in Improving Soil Quality, Crop Productivity, and Toxic Metal Amelioration.” Journal of Environmental Management, vol. 277, 2021.
“Biochar Compost.” Pacific Biochar, https://pacificbiochar.com/biochar-compost/. Accessed 3 Mar. 2025.
Edeh, Ifeoma Gloria, and Ondřej Mašek. “The Role of Biochar Particle Size and Hydrophobicity in Improving Soil Hydraulic Properties.” European Journal of Soil Science, vol. 73, 2022, e13138. Wiley Online Library, doi:10.1111/ejss.13138.
“How to Use Biochar in Compost.” Kansas Forests, www.kansasforests.org/forest_products/forest_product_docs/biochar_info/How%20to%20Use%20Biochar%20in%20Compost_Print.pdf. Accessed 3 Mar. 2025.
Jobson, Tom. “Comparing Methods to Measure Air Emissions from Commercial Compost Facilities.” Washington State Department of Ecology, https://apps.ecology.wa.gov/publications/documents/2207002.pdf. Accessed 3 Mar. 2025
Kamarudin, Nur Salsabila, et al. “Biochar: A Review of its History, Characteristics, Factors that Influence its Yield, Methods of Production, Application in Wastewater Treatment and Recent Development.” Biointerface Research in Applied Chemistry, 2021, biointerfaceresearch.com/wp-content/uploads/2021/12/20695837126.79147926.pdf.
de Oliveira Paiva, I., de Morais, E.G., Jindo, K. et al. Biochar N Content, Pools and Aromaticity as Affected by Feedstock and Pyrolysis Temperature. Waste Biomass Valor 15, 3599–3619 (2024). https://doi.org/10.1007/s12649-023-02415-x
Singh, B., et al. “Biochar pH Electrical Conductivity and Liming Potential.” International Biochar Initiative, 2017, biochar-international.org/wp-content/uploads/2019/11/2017_Biochar_pH_electrical_conductivity_and_liming_potential_Singhetal.pdf.
Sundberg, C., and H. Jönsson. “Higher pH and Faster Decomposition in Biowaste Composting by Increased Aeration.” Waste Management, vol. 28, 2008, pp. 518-526.
